
This is an update to our 2015 Scientific Reports paper: Comparing the model-simulated global warming signal to observations using empirical estimates of unforced noise. The paper used a novel statistical estimate of unforced variability that was derived from reconstructed and instrumental surface temperature records. We used our statistical estimate of unforced variability to aid in our interpretation of recently observed temperature variability (more info here).
Our paper used global temperature data through 2013 since that was the most recent year in the major global temperature datasets at the time that the paper was submitted. Below I update Figures 2 and 3 from the paper, incorporating the back-to-back record breaking warmth of 2014 and 2015.
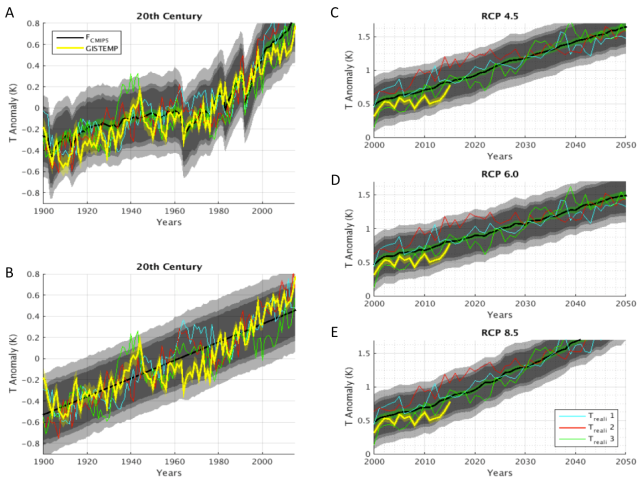
Figure 2 updated to include 2014 and 2015.
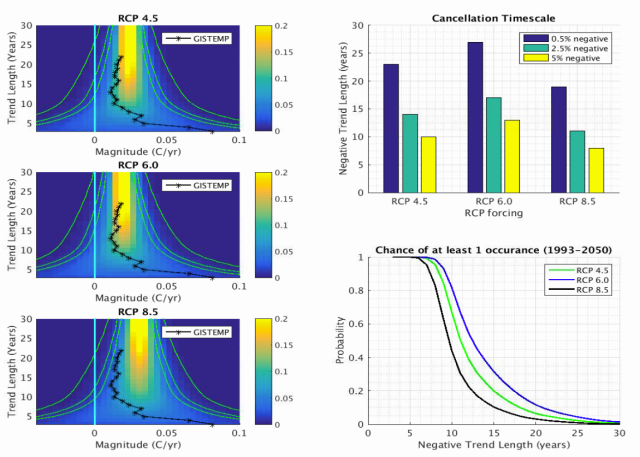
Figure 3 updated to include 2014 and 2015.
The summary section of our paper stated:
We find that the interdecadal variability in the rate of global warming over the 20th century (i.e., acceleration from ~1910–1940, deceleration until ~1975, acceleration until ~2000) is within the 2.5–97.5% EUN, even if the forced signal is represented as a linear trend, indicating that this observed interdecadal variability in the rate of warming does not necessarily require interdecadal variability in the rate-of-increase of the forced signal.
This statement was about 20th century temperature and thus updates for 2014 and 2015 are somewhat irrelevant. Nevertheless, the updated Figure 2 (bottom left panel) indicates that recent warmth is just now starting to emerge from a linear-trend null hypothesis. This is not to say that a linear trend is the most likely representation of the forced component of variability – it just means that the linear trend forced component can’t quite be ruled out. This is now starting to change as observations move above the 97.5th percentile of the unforced range.
The summary section also stated:
We also find that recently observed GMT values, as well as trends, are near the lower bounds of the EUN for a forced signal corresponding to the RCP 8.5 emissions scenario but that observations are not inconsistent with a forced signal corresponding to the RCP 6.0 emissions scenario.
Note that we were not making a forecast about how likely the RCP 8.5 emissions scenario was. Instead, we were using the the multi-model mean warming associated with the RCP 8.5 emissions scenario (out to 2050) as a representation of the quickest rate of forced warming that could conceivably be occurring over the recent past (see here and here for further clarification).
The Figure 3 indicates that with the updated data, no trend over the past 25 years falls outside of the 5-95% range for any of the scenarios. The trends over the most recent ~5 years are higher than average for all the scenarios but still well within the range of unforced variability. Over the past 10-20 years, observed trends have been on the lower end of the RCP 8.5 range but closer to the middle of the RCP6.0 range. This indicates that over the past 10-20 years it may be more likely that we have been on a RCP6.0-like warming trajectory than a RCP8.5-like warming trajectory. This is similar to the conclusion of the original study.
