
Question: How do we know that the world is warming?
Answer: Scientists use data from meteorological stations, ships, buoys and satellites to construct instrumental records of temperature as far back as the late 19th century. These temperature reconstructions show a significant warming of the globe over this time period (figure 1).
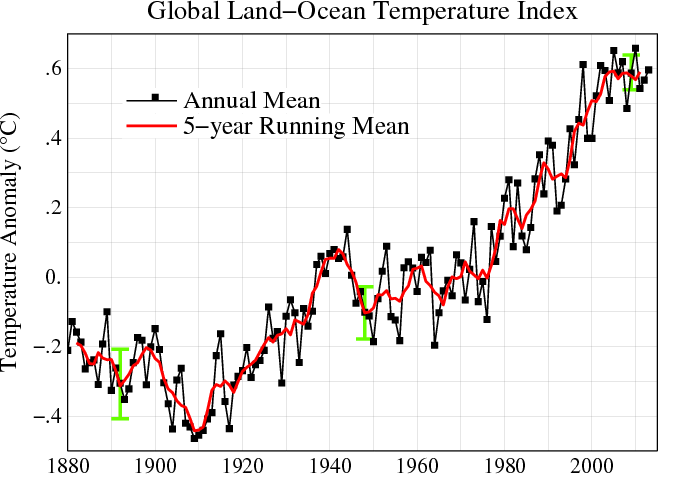
figure 1 – National Aeronautics and Space Administration (NASA) global surface temperature over the period 1880-2013 expressed relative to the average temperature from 1951-1980 (figure source:http://data.giss.nasa.gov/gistemp/graphs/)
In addition to directly measuring temperature changes, scientists can infer temperature changes by making observations of the natural world. Many natural systems are changing in a manner that is consistent with warming. Such systems include, but are not limited to, alpine glaciers (figure 2), ice sheets (figure 3), Arctic sea ice (figure 4) and sea level (figure 5).
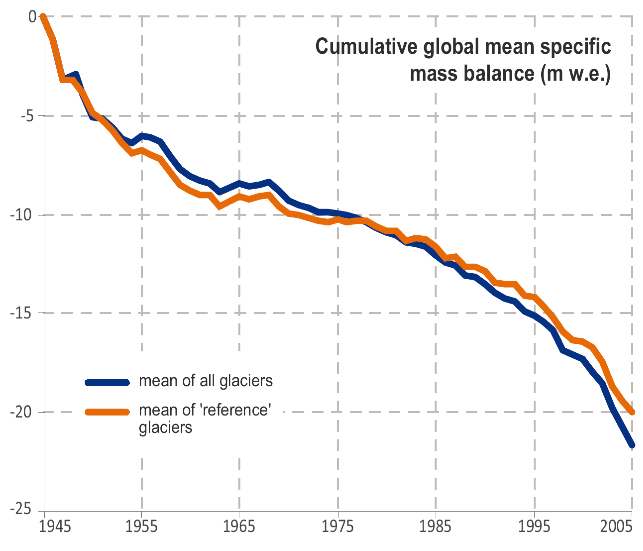
figure 2 – World Glacier Monitoring Service (WGMS) global glacier mass balance over the period 1945-2005
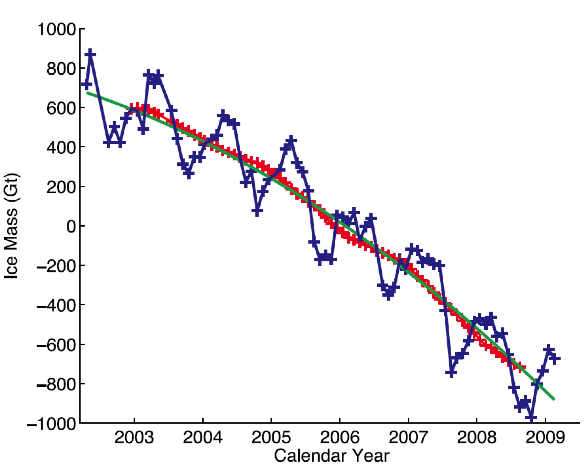
figure 3 – Satellite derived Ice mass in Greenland (left) and Antarctica (right) over the period 2002-2009.
(figure source: http://www.grid.unep.ch/glaciers/pdfs/5.pdf)
(figure source: Velicogna, 2009)
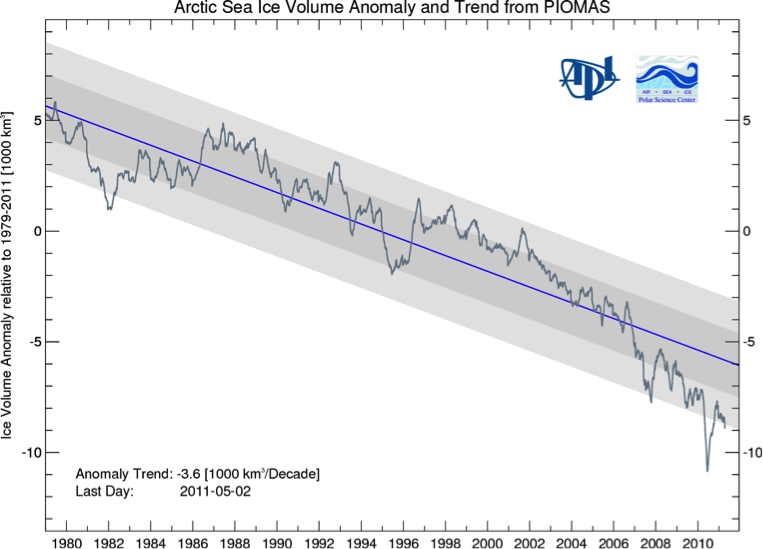
figure 4 – University of Washington Polar Science Center arctic sea ice volume over the period 1979-2011.
(figure source: http://psc.apl.washington.edu/wordpress/research/projects/arctic-sea-ice-volume-anomaly/)
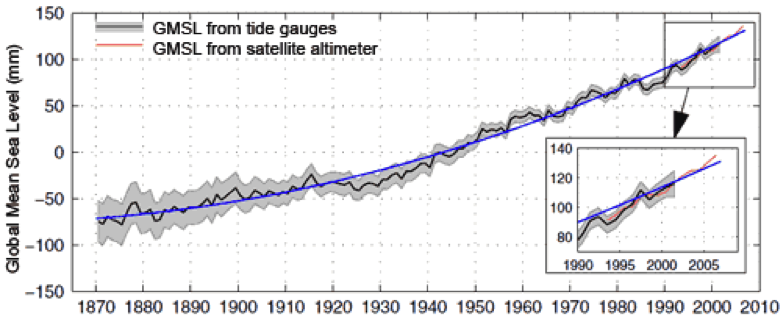
figure 5 – Global sea level over the period 1870-2008
(figure source: http://academics.eckerd.edu/instructor/hastindw/MS1410-001_FA08/handouts/2008SLRSustain.pdf)
Further Reading:
NASA Global Climate Change Key Indicators
References:
Velicogna, I. (2009), Increasing rates of ice mass loss from the Greenland and Antarctic ice sheets revealed by GRACE, Geophys. Res. Lett., 36, L19503, doi:10.1029/2009GL040222.
Question: How can there be global warming when last week/month was so cold?
Answer: The local temperature at any given location is mostly determined by changes in the flow of heat around the Earth’s surface. This idea is illustrated in weather maps that represent the movement of cold and warm air with fronts (figure 1). If cooler air moves over a particular location this will generally be cancelled out by warmer air moving over some other location. In fact, the Earth’s average surface temperature only varies by about 0.1-0.2°C from year to year. This means that local weather is a poor indicator of the global temperature and therefore it is quite possible for a given location to experience prolonged cool periods in spite of global warming.

figure 1 – Typical North American weather map
Question: Hasn’t climate changed before?
Answer: Yes. Climate change has occurred many times in the Earth’s 4.5 billion year history due to a variety of causes. Scientists use these past changes in climate to better understand the changes we are currently experiencing.
Many of Earth’s previous climate changes were due to factors that changed slowly over long periods of time (tens of thousands to hundreds of millions of years). These factors include changes in the position and drift rate of continents as well as changes in Earth’s orbit around the Sun. Because these factors only affect climate on very long time scales, they cannot be responsible for the warming that we have seen over the past century.
Natural factors that affect Earth’s climate on centennial time scales include changes in the brightness of the sun as well as changes in the frequency of large volcanic eruptions. These two factors likely dominated natural climate variability over the past 1000 years prior to the industrial revolution (Crowley, 2000). These fluctuations have not, however, been of the same magnitude as the changes that are currently being experienced (figure 1).
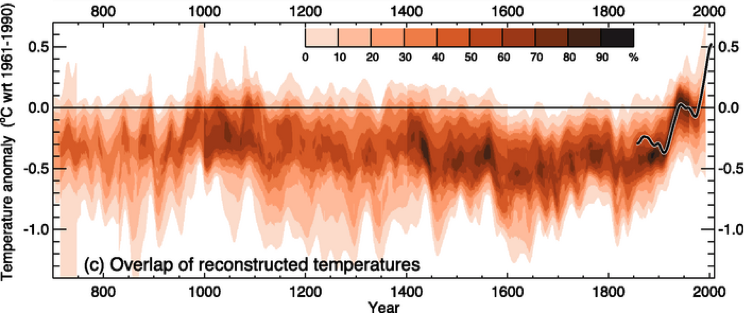
figure 1 – Reconstruction of Northern Hemisphere temperatures over the last 1300 years
(figure source: http://www.ncdc.noaa.gov/oa/climate/globalwarming.html
Further Reading:
EPA Past Climate Change
References:
Crowley, T.J. (2000) Causes of climate change over the past 1000 years. Science, 289 (5477), 270–277.
Question: Why do scientists think that current climate change is being caused by humans?
Answer: The main reason has to do with the fundamental physics of the greenhouse effect. Greenhouse gasses are transparent to solar radiation but are relatively opaque to terrestrial radiation. This means that greenhouse gasses inhibit the Earth’s ability to radiate energy to space. Therefore, all else being equal, a higher atmospheric concentration of greenhouse gasses should work to warm the Earth’s surface. Observations corroborate this idea by showing that the Earth has indeed warmed as the atmospheric concentration of greenhouse gasses like CO2 have increased (figure 1).
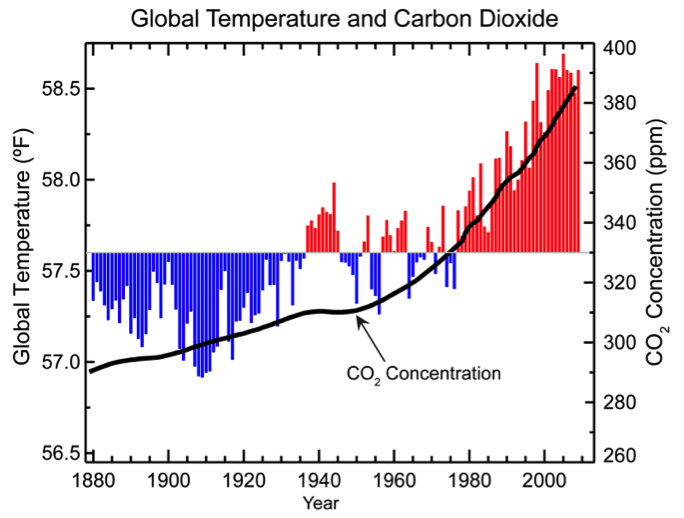
figure 1 – Global temperature and CO2 concentration from 1880-2009 (figure source:http://www.ncdc.noaa.gov/indicators/)
In addition to causing warming, an increase in the Earth’s greenhouse effect should cause less infrared energy to escape to space and should cause more infrared energy to return to the Earth’s surface. Both of these effects have been observed (Harries, 2001; Philipona, 2004) which strongly indicates that the warming we are currently experiencing is a result of an enhanced greenhouse effect.
Another reason that scientists think humans are responsible for the current warming is that there is no satisfactory natural explanation. Past climate changes that have to do with plate tectonics and orbital forcings are too slow to be responsible while changes in solar brightness and volcanic activity are not sufficient to account for the observed warming. This idea can be demonstrated with climate models which are mathematical representations of the Earth’s climate run on supercomputers. When known changes in solar brightness and volcanic activity are included in climate models, they do a good job of reproducing much of climate variability over the past 1000 years. However, climate models cannot reproduce the recent warming that we have observed unless they include the dramatic increase in the atmospheric concentration of greenhouse gasses (figure 2).
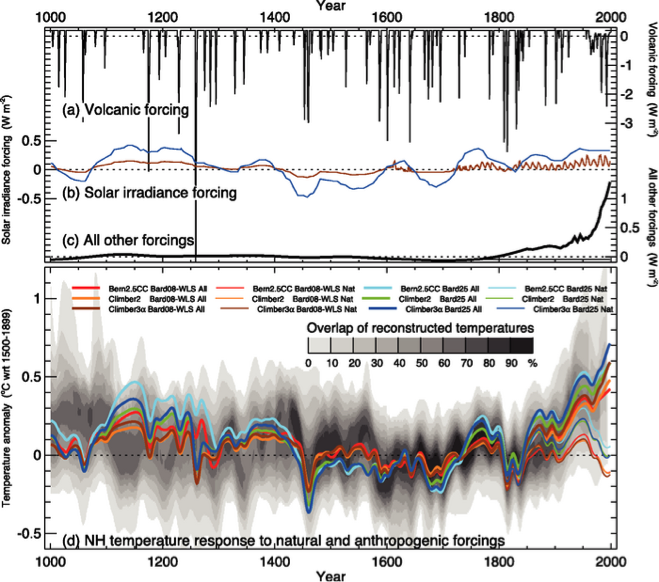
figure 2 – Top: Major causes of Northern Hemisphere temperature changes over the last 1000 years.
Bottom: reconstructed temperature changes over the last 1000 years (grey shading) and climate model simulations of temperature changes over the past 1000 years (colored lines). The thin colored lines represent simulations that did not include increased greenhouse gas concentrations during the 19th and 20th centuries while the thick colored lines represent simulation that did include increased greenhouse gas concentrations during the 19th and 20th centuries. Notice how only the simulations that include greenhouse gas increases can reproduce the observed warming at the end of the period. (figure source:http://www.ipcc.ch/publications_and_data/ar4/wg1/en/ch6s6-6-3-2.html)
Further Reading:
NASA Global Climate Change Causes
References:
Harries J.E., H. E. Brindley, P. J. Sagoo and R. J. Bantges (2001), Increases in greenhouse forcing inferred from the outgoing longwave radiation spectra of the Earth in 1970 and 1997, Nature 410, 355-357, doi:10.1038/35066553
Philipona, R., B. Dürr, C. Marty, A. Ohmura, and M. Wild (2004), Radiative forcing ‐ measured at Earth’s surface ‐ corroborate the increasing greenhouse effect, Geophys. Res. Lett., 31, L03202, doi:10.1029/2003GL018765.
Question: How can we project climate change out toward the end of the century when we can’t even predict the weather 2 weeks from now?
Answer: Local weather is the result of somewhat random fluctuations in the flow of the atmosphere around the planet. This makes the weather at any given location difficult to predict past about a week in time. Climate, or average weather, on the other hand, is largely determined by external forcings that are more predictable.
This idea is exemplified each year in the seasonal cycle. Summer is warmer than winter because days are longer and the sun is higher in the sky. Even though any given location will experience random weather fluctuations, we can count on summer being warmer than winter because the changes in solar radiation dominate any random weather changes over periods longer than a couple months in length. Similarly, changes in global climate can be projected into the future because on the decade to decade scale, changes in greenhouse gasses dominate random fluctuation in weather.
Further Reading:
IPCC FAQ What is the relationship between climate change and weather?
Question: Weren’t scientists all predicting global cooling in the 1970′s?
Answer: No. From the 1940s to the 1970s, the global surface temperature decreased very slightly. This probably occurred because over that time period the cooling effect from human produced aerosols was slightly larger than the warming effect from human produced greenhouse gasses. A minority of scientists predicted that the cooling effect from increasing aerosols would continue to outweigh the warming effect from increasing greenhouse gasses and that the climate would continue to cool. This idea received some public attention when Time magazine published an article titled “Another Ice Age?” in 1974. This article did not represent the views of the majority of the scientific literature at the time (figure 1). For example, a 1975 a paper, published by Wallace Broecker contained the following abstract:
“If man-made dust is unimportant as a major cause of climatic change, then a strong case can be made that the present cooling trend will, within a decade or so, give way to a pronounced warming induced by carbon dioxide. By analogy with similar events in the past, the natural climatic cooling which, since 1940, has more than compensated for the carbon dioxide effect, will soon bottom out. Once this happens, the exponential rise in the atmospheric carbon dioxide content will tend to become a significant factor and by early in the next century will have driven the mean planetary temperature beyond the limits experienced during the last 1000 years.”
This prediction turned out to be remarkably accurate.
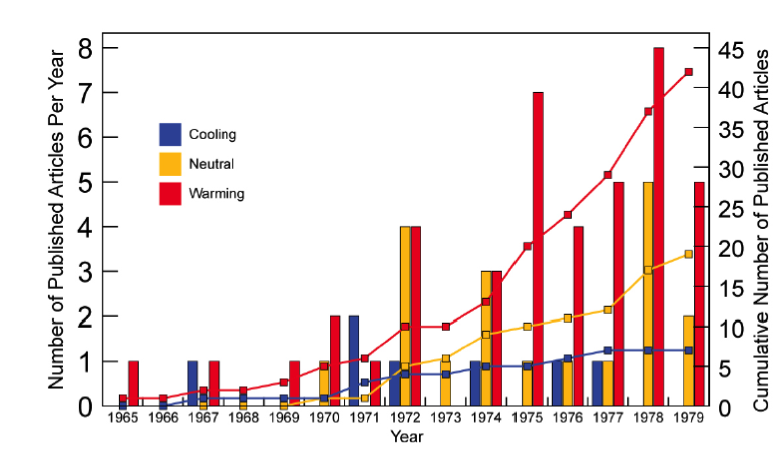
figure 1 – Number of scientific papers that predicted cooling, warming, or neutral temperature change by the year of publication.
(figure source: Peterson, 2008)
References:
Broecker, W. (1975) Climatic Change: Are we on the brink of a pronounced global warming?, Science, Vol. 189 no. 4201 pp. 460-463
DOI: 10.1126/science.189.4201.460
Peterson C. T., W. Connolley, J. Flec (2008) The myth of the 1970s global cooling scientific consensus, Bulletin of the American Meteorological Society, 10, 1325-1337, doi:10.1175/2008BAMS2370.
Question: Don’t humans produce just a small percentage of the total carbon that is emitted into the atmosphere?
Answer: Carbon is constantly moving between the atmosphere, ocean, land and biosphere (figure 1). Before humans started burning fossil fuels, all this movement of carbon was balanced so that, over the previous few thousand years, there was no net change in the amount of CO2 in the atmosphere. Ever since the industrial revolution, however, the burning of fossil fuels has introduced a new source of carbon that did not previously exits. This new source is only a small part of the total carbon cycle but it has caused the concentration of CO2in the atmosphere to increase by nearly 40% (figure 2). Therefore, it is true that humans produce only a small percentage of the total carbon that enters the atmosphere in any given year, however, humans are responsible for almost 100% of the increase in atmospheric CO2 that has occurred since the industrial revolution.
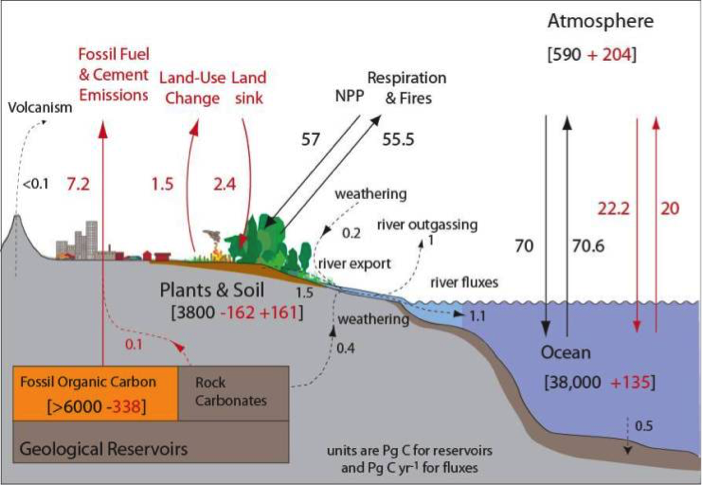
figure 1 – The global carbon cycle in petagrams of carbon
(figure source: http://www.pmel.noaa.gov/co2/file/Carbon+Cycle+Graphics)
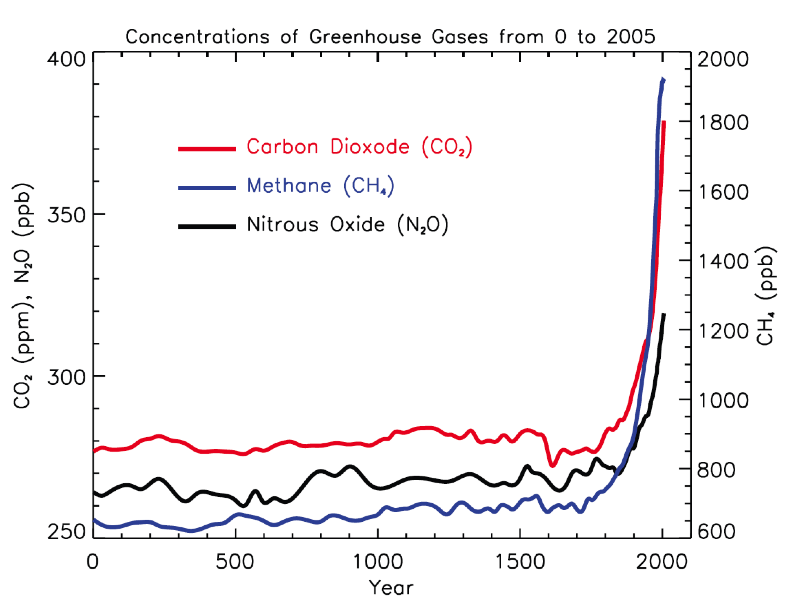
figure 2 – Concentrations of major greenhouse gasses over the last 2000 years
(figure source: http://gcmd.nasa.gov/records/GCMD_WMO_Concentrations_greenhouse_gases0-2005.html)
Further Reading:
IPCC Are the Increases in Atmospheric Carbon Dioxide and Other Greenhouse Gases During the Industrial Era Caused by Human Activities?
Question: Why would a few degrees of warming be a big deal?
Answer: Because we all experience temperature changes of tens of degrees every day, a few degrees of global warming may not seem like a lot. A few degrees of change in the global surface temperature can, however, indicate a drastic change in the Earth’s climate. This can be exemplified by considering climate changes of the past. The last ice age, for example, was characterized by permanent glaciers over much of North America and Eurasia despite the fact that the Earth was only 5°C-8°C cooler than today. Also, more recent fluctuation in global climate over the last 2000 years have been characterized by temperature swings of only ~0.5°C but have had large enough effects to receive names like the “Medieval Warm Period” and the “Little Ice Age”.
We have experienced only about 0.8°C of warming since the 19th century but the effects are already detectible on many natural systems (IPCC, 2007). Furthermore, this 0.8°C change is small compared to the warming projected for the remainder of the 21st century (figure 1). It is difficult to predict the exact consequences of such warming but studies suggest that more negative outcomes will be seen as more warming occurs (figure 2).
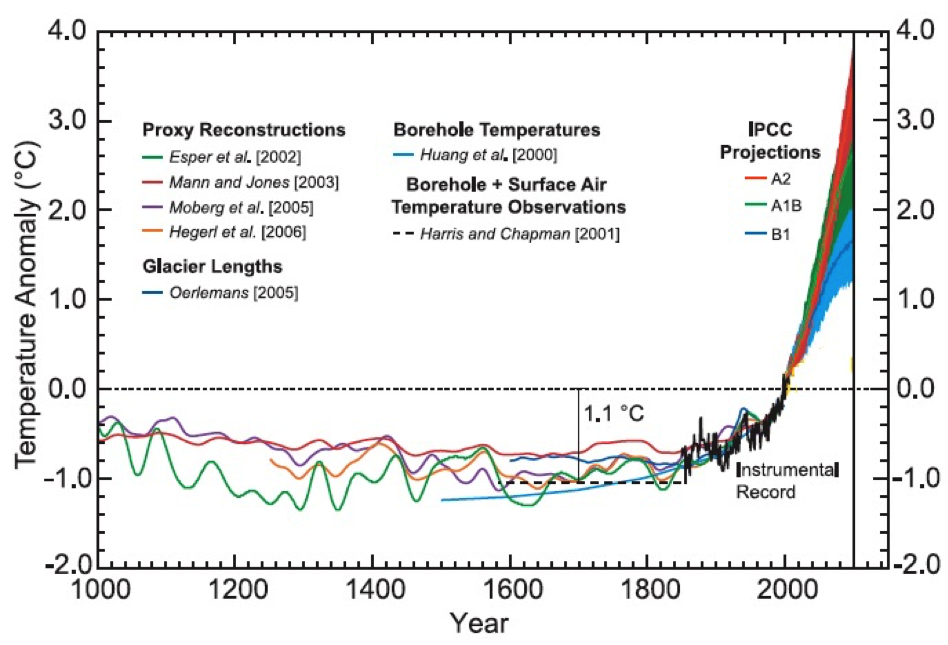
figure 1 – Projected global warming over the next century in the context of climate change over the past 1000 years. Future projections differ depending on estimated changes in human greenhouse gas emissions. (figure source: Chapman and Davis, 2010)
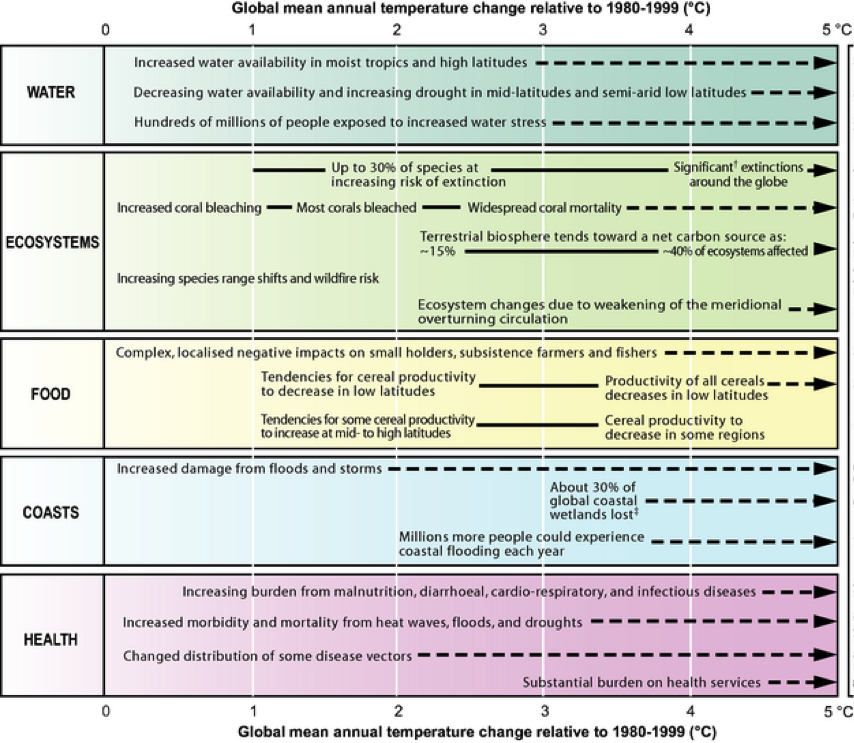
figure 2 – Expected consequences of climate change as a function of future warming
(figure source: http://www.ipcc.ch/publications_and_data/ar4/wg2/en/figure-spm-2.html
References:
Chapman D. S., and M. G. Davis (2010) Climate Change, Past, Present, and Future, EOS Vol. 91, No. 37, 325-332
IPCC, 2007: Summary for Policymakers. In: Climate Change 2007: Impacts, Adaptation and Vulnerability. Contribution of Working Group II to the Fourth Assessment Report of the Intergovernmental Panel on Climate Change, M.L. Parry, O.F. Canziani, J.P. Palutikof, P.J. van der Linden and C.E. Hanson, Eds., Cambridge University Press, Cambridge, UK, 7-22.
Further Reading:
IPCC Climate Change 2007: Working Group II: Impacts, Adaption and Vulnerability Magnitudes of impact
Question: Didn’t “Climate Gate” show that the science of global warming was based on fabricated data?
Answer: “Climate Gate” refers to a situation where the servers of the University of East Anglia were illegally hacked and personal emails from a group of scientists associated with the Climate Research Unit (CRU) were posted online. Thousands of personal emails were published that spanned a time period of over a decade. Out of these thousands of emails, a handful of quotes have been promoted as evidence of a scientific conspiracy.
It should be noted that the science behind global warming has been built up over the last century by scientists at hundreds of different of organizations and therefore would not simply crumble if one group of scientists had been found to be corrupt. Nevertheless this was a serious allegation and it was investigated by at least 5 independent reviews that sought to determine the extent to which scientists had misrepresented findings. These reviews have unanimously found that the scientists under investigation were not fabricating findings and that there is no reason to doubt the science behind climate change.
Below are some selected conclusions from these reports:
“After careful consideration of all the evidence and relevant materials, the inquiry committee finding is that there exists no credible evidence that Dr. Mann had or has ever engaged in, or participated in, directly or indirectly, any actions with an intent to suppress or to falsify data. While a perception has been created in the weeks after the CRU emails were made public that Dr. Mann has engaged in the suppression or falsification of data, there is no credible evidence that he ever did so, and certainly not while at Penn State. In fact to the contrary, in instances that have been focused upon by some as indicating falsification of data, for example in the use of a “trick” to manipulate the data, this is explained as a discussion among Dr. Jones and others including Dr. Mann about how best to put together a graph for a World Meteorological Organization (WMO) report. They were not falsifying data; they were trying to construct an understandable graph for those who were not experts in the field. The so-called “trick” was nothing more than a statistical method used to bring two or more different kinds of data sets together in a legitimate fashion by a technique that has been reviewed by a broad array of peers in the field.”
– RA-10 Inquiry Report: Concerning the Allegations of Research Misconduct Against Dr. Michael E. Mann, Department of Meteorology, College of Earth and Mineral Sciences, The Pennsylvania State University
“We saw no evidence of any deliberate scientific malpractice in any of the work of the Climatic Research Unit and had it been there we believe that it is likely that we would have detected it. Rather we found a small group of dedicated if slightly disorganised researchers who were ill-prepared for being the focus of public attention. As with many small research groups their internal procedures were rather informal.”
-Report of the International Panel set up by the University of East Anglia to examine the research of the Climatic Research Unit.
“Regarding data availability, there is no basis for the allegations that CRU prevented access to raw data. It was impossible for them to have done so.”
“Regarding data adjustments, there is no basis for the allegation that CRU made adjustments to the data which had any significant effect upon global averages and through this fabricated evidence for recent warming.”
“We do not find that the data described in AR4 and shown in Figure 6.10 is misleading, and in particular we do not find that the question marks placed over the CRU scientists’ input cast doubt on the conclusions.”
“In summary, we have not found any direct evidence to support the allegation that members of CRU misused their position on IPPC to seek to prevent the publication of opposing ideas.”
-The Independent Climate Change E-mails Review
