
Ranking Sports Teams According to Cumulative Connections
Introduction
What is the best way to judge and rank different sports teams? The first intuitive answer may be to simply order them according to their win-loss records. In fact, most regular season division/conference championships in both college and professional sports are awarded to the team with best overall win/loss record. This can be justified as long as most of the teams in the conference or division have played most of the other teams (i.e., the season has come close to being a round robin tournament). However, it becomes very difficult to compare teams from different conferences who may not have played each other and may share very few common opponents. Additionally, the way conferences are set up in college sports, most of the best teams play together in groups. This means that different teams from different conferences will have drastically different levels of competition.
When attempting to assess the relative merits of teams that do not share many common opponents, we know that simple win-loss record is insufficient. The next solution is usually to take a poll of sports writers or coaches and average the responses together to form a ranking. This may problematic for many reasons. Poll respondents may be biased toward teams that they see most often on TV or those that get more attention because of a flashy player or coach. They may be biased towards teams or conferences that have better reputations. They may be susceptible to groupthink (i.e., they see the results of the poll every week and they may adjust their ballots so that it better agrees with the consensus).
It is therefore desirable to be able to rank teams with vastly different levels of competition without incorporating human biases. The method outlined here attempts to do just that.
Method
This method attempts to rank teams not just by their total number of wins and losses but by their cumulative wins and losses as assessed by their opponents wins and losses and their opponents opponents wins and losses ect. The basic idea behind this method is that when team A beats team B. Team A receives a ‘vote’ from team B. How much is this vote worth? It depends on how many teams have voted for B (i.e., how many teams has B beaten). If team B has beaten many teams which in turn have beaten many other teams, then this vote should be worth a lot. If team B has not beaten very many teams than this vote should not be worth very much. This is the exact same principle that Google’s Page Rank algorithm uses to rank web pages in search results. In Google’s case, however, ‘votes’ translate into links. The web pages ranked the highest are the ones that have many links to them from websites that are linked to by many other websites ect.
The way to solve this problem mathematically involves graph theory. Essentially it requires creating a connectivity matrix between all the teams and finding the largest eigenvector of this matrix. Most of the mathematics behind this method are described in Keener (1993).
The best way to get an intuitive understanding of this method is to look at a simple example with a limited number of teams.
Lets take this simulated basketball season from 7 teams (a,b,c,d,e,f,g). There were 11 total games and they were not distributed equally among the teams. The method is able to account for the uneven distribution by dividing the resulting score by the number of games played for each team.
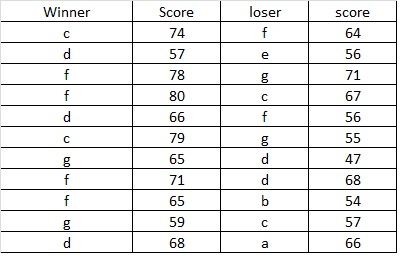
First I will show the results of the ranking method applied to this data and then I will explain it. Here are the results:

The best way to visualize how this method works is in the form of a graph of the entire season (below). In this graph, an arrow represents a win or a ‘vote’. So for example, since team ‘d’ beat team ‘e’, team ‘e’ has an arrow pointed toward team ‘d’. If two teams played multiple times and each team won a game, then the arrows point in both directions. Teams are ordered according to their resulting rank starting at the top (team ‘f’) and moving clockwise around the circle.
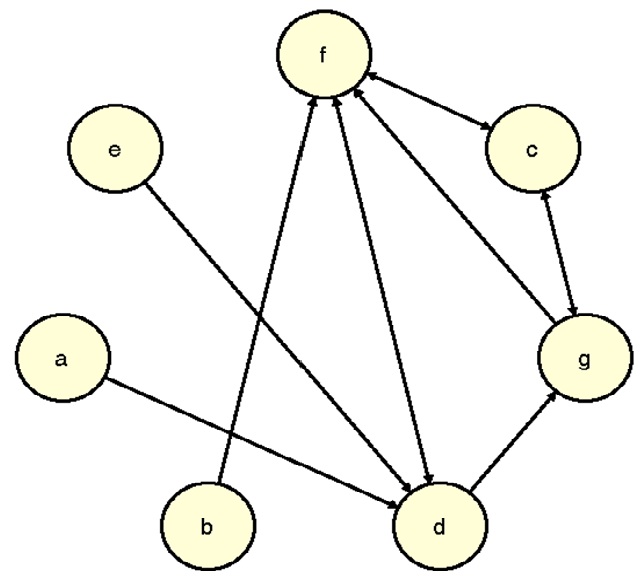
The graph makes it easier to see why the rankings came out the way that they did. The teams with the highest rankings had the most cumulative connections in the graph (e.g., team ‘f’ had a lot of votes from other teams that in turn had a lot of votes and so on). In general the arrows indicate a flow from the worst teams to the best teams. Notice how team ‘d’ (with a record of 3-2) is ranked behind teams ‘c’ and ‘g’ (with records of 2-2). This is because 2 of team ‘d’s wins came from winnless teams and thus those wins did not help teams ‘d’s score very much.
Two Additional Factors
1) Losses
In the above description a loss is simply a lost opportunity to receive a vote but there is no explicit penalty for losing to a very bad team. To account for this, the method also calculates the cumulative loss connections and the final ranking results from calculating the difference between each teams cumulative wins and losses. This means that it is much worse for a teams ranking if it losses to a team with many losses than if it loses to a team with few losses.
2) Margin of Victory
In the above description there is no account for margin of victory. When two teams play each other, there is one ‘vote’ up for grabs and it can only be rewarded to one of the two teams. A better strategy may be to use the score of the game and to distribute that single vote among the two teams according to the score. For example, team ‘d’ beat team ‘e’ by a score of 57-56. Instead of team ‘d’ receiving 1 vote from team ‘e’ and team ‘e’ receiving nothing from team ‘d’, the vote can be distributed as 57/(56+57)=0.5044 for team ‘d’ and 56/(56+57)=0.4956 for team ‘e’.

Nice Article. Simple and succinct. I am interested in this topic and am working on something very similar.
Please tell me how to caluculate the score. I study economics, especially market design at the university in Japan. And I am interested in improvement a ranking method of Japanese lacrosse reague. I think this idea is useful for that.
spelling mistake
reague⇒league
How did it went… Im looking for someone that can help me or sell an algorithm for a ranking in a sport
I’m an 11s coach in USAV (volleyball). My teams are consistently ranked very high in our region. The competition in our age group is fairly weak except for the top 10ish teams in the region. My teams always play up an age group (12s). Any way to account for this?