
Estimating the human influence on extreme weather events and their economic costs is relevant to many policy discussions around climate change including those that concern the social cost of carbon.
There are many different ways to estimate the economic costs of climate change that range from theoretical to empirical and apply to entire economies or the impacts of single events.
In this post, I will discuss a particular method used to estimate the economic damages attributable to climate change for a single disaster.
Attributable Costs
The method has been referred to as the “attributable costs” method. It traces its origins to a 2003 Nature commentary called “Liability for climate change” (Allen, 2003). The critical passage is the following:
“If at a given confidence level, past greenhouse-gas emissions have increased the risk of a flood tenfold, and that flood occurs, then we can attribute, at that confidence level, 90% of any damage to those past emissions”.
The statement above was hypothetical but more recently, this reasoning has been adopted in the climate impacts literature.
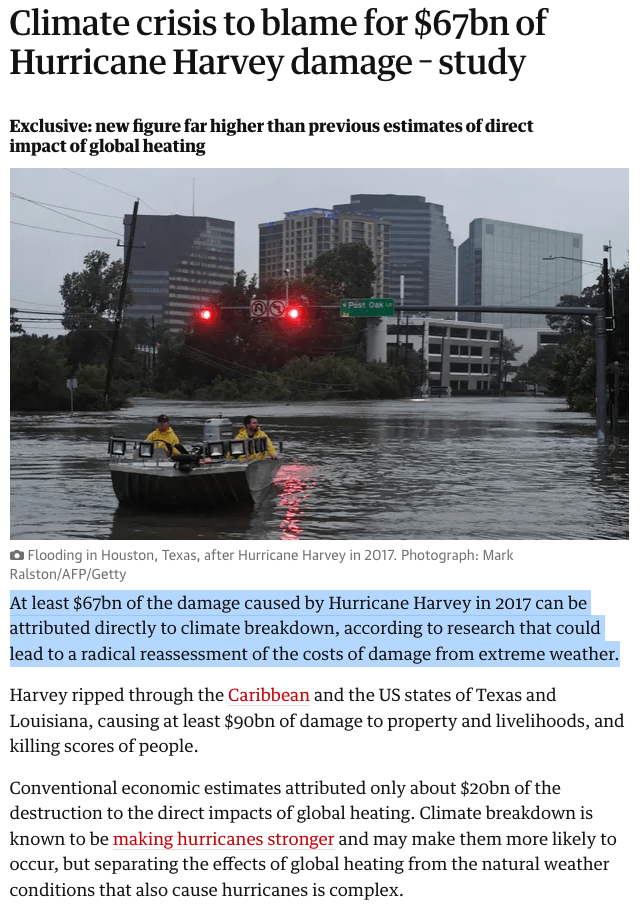
Notably, it was used in an assessment of the economic impact of human influence on Hurricane Harvey (Frame et al., 2020). Specifically, Frame et al. (2020) state that estimated damages from Hurricane Harvey were $90 billion and that human influence on the climate was responsible for 75% of this $90 billion or ~$67 billion. They then use this number to argue that traditional estimates of the costs of climate change that inform the social cost of carbon estimates are drastically underestimated, as the authors’ post on Carbon Brief communicates:
Cost of extreme weather due to climate change is severely underestimated.
This study received a great deal of attention. According to Altmetric, of over 20 million research outputs tracked, it was in the 99th percentile in terms of online attention. It was cited prominently (5 times) in the IPCC AR6 Working Group 2 Report. It was promoted on social media by high-profile climate communicators, endorsed by a climate scientist on Time Magazine’s 100 most influential people list, and made headlines in places like The Guardian.
Despite the attention and high-profile influence of this study and others like it, I believe it contains a fundamental flaw in reasoning that undermines its results.
The study makes use of the concept of the “Fraction of Attributable Risk (FAR)” which is a concept borrowed from epidemiology (Levin et al., 1953).
The idea is that you can quantify how a change in conditions affects the risk of some outcome. For example, it can quantify how exposure to a particular chemical affects the risk of contracting cancer over some period of time. The formula is,
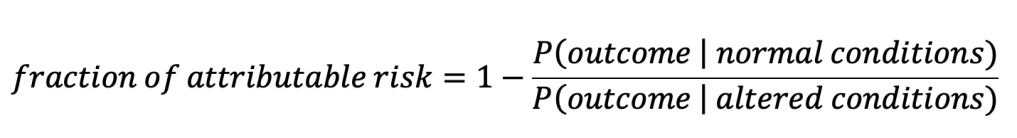
where P(outcome | normal conditions) should be read as “the probability of the outcome given normal conditions”. For the chemical-cancer example, the outcome would be the contraction of cancer, normal conditions would correspond to a group not exposed to the chemical and altered conditions would correspond to a group exposed to the chemical. Probabilities of cancer for the two groups could be estimated empirically by calculating the percentage in each group that was observed to contract cancer (Attributable fraction among the exposed).
If exposure to the chemical doubles the risk of cancer, and an exposed individual contracts cancer, then half of the risk of their contraction of cancer can be attributed to exposure to the chemical. If exposure to the chemical triples the risk of cancer then 2/3rds of their risk of cancer can be attributed to exposure and so on.
Now, we can further imagine that treatment of this cancer universally costs $20,000. If the fraction of attributable risk is 3/4ths or 75%, then a person exposed to the chemical with cancer can claim that
(0.75)x($20,000) = $15,000
of the expense of cancer treatment is due to that exposure.
This is the “attributable costs” method. Expressed as a formula it is:
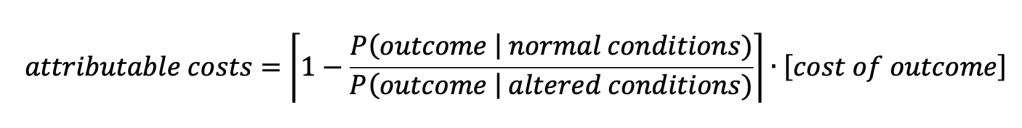
Implicit in the above formula is the notion that there is no cost if the outcome does not take place. In that sense, you could also think of the fraction of attributable risk as being multiplied by the difference between the cost with the outcome and the cost without the outcome where the cost without the outcome is zero.

The reasoning here makes sense because contracting cancer can more-or-less be considered a binary (either you contract it or you don’t). That means the $20,000 cost for treatment is also a binary (either $20,000 is paid for treatment or $0 for no treatment) and thus the ‘cost without outcome’ is zero and you can calculate the full financial impact by using the “attributable costs” method which simply multiplies the fraction of attributable risk by the expense of the outcome.
Analogously, the attributable costs of a weather event to human influence on the climate can be written as:
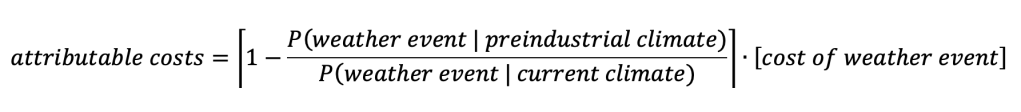
In Frame et al. (2020) they are interested in quantifying the economic damage from Hurricane Harvey that is due to human influence. But the first issue that arises is how to define the “weather event” they are studying.
The first idea that might come to mind might be that “landfalling tropical cyclones” constitute the event. Landfalling tropical cyclones are discrete phenomena that can be said to either occur or not and would thus more-or-less fit into this framework. However, many estimates of changes in tropical cyclone activity actually project a decrease in total tropical cyclone number under climate change. This would yield a negative attributable cost. However, the researchers of Hurricane Harvey weren’t necessarily interested in changes in the odds of all landfalling tropical cyclones but rather changes in the odds of tropical cyclones very much like Hurricane Harvey. Harvey was notable, in particular, because of its extreme rainfall and there is robust evidence that the most extreme rainfall should be enhanced as the world warms.
Thus, Frame et al. (2020) define the “weather event” using rainfall totals that breach the threshold of being as high or higher than what was seen during Hurricane Harvey.
Unlike landfalling tropical cyclones, however, rainfall totals are not really discrete phenomena that you can count in the same way. It’s more natural to think of rainfall totals as coming from a continuous probability distribution of possible rainfall totals.
This move from a discrete weather event, to defining an “event” by choosing a threshold from a continuum renders the “attributable costs” method invalid. When we unpack the logic into steps we can see where it breaks down:
- Hurricane Harvey caused $90 billion in damage
- The definition of the “event” representing Harvey is rainfall at or above the amount seen during Harvey
- Human influence on the climate is responsible for 75% of the risk of the “event”, so defined.
- Thus, human influence on the climate is responsible for 75% of $90 billion of damage, or $67 billion.
The above reasoning smuggles in the idea from the epidemiological example that the “event” is dichotomous: either it occurs or it does not and thus the $90 billion in damage either occurs or it does not. The reasoning requires that the ‘cost without the outcome’ is zero.
The costs from cancer only activate if you contract cancer. There are no costs for cancer if you don’t contract cancer. But the costs from rainfall begin to accumulate long before the event threshold is reached. There are costs from rainfall even when there is no ‘event’, so defined.
One could argue that the cost without the outcome would be zero if the ‘event’ was landfalling tropical cyclones (if there is no landfalling tropical cyclone then there is no damage from a landfalling tropical cyclone) but one cannot claim this for rainfall beyond a threshold. Imagine 1/100th of an inch less rain fell during Harvey. Would the $90 billion in damage disappear? Of course not. All of the rain from Harvey, including that last 1/100th of an inch, is required for the 75% ‘fraction of attributable risk’ to be valid but not all of the rain is required for there to be any damage at all.
In summary, the authors of Frame et al. (2020) are implicitly attributing all $90 billion in damages to the very last 1/100th of an inch of rainfall which is what allowed the arbitrary threshold to be crossed and ‘eventhood’ to be achieved. This flawed reasoning also applies to the original 2003 Nature commentary which used flooding as the example.
Changes in the Magnitude of an Event
A much clearer framing of the question is obtained when human influence on changes in the magnitude of some aspect of the weather are focused on rather than the frequency of crossing an arbitrary threshold (I have discussed the relationship between these previously Brown, 2016). Some of the studies referenced in Frame et al. (2020) also estimate the human influence on the magnitude of rainfall during Harvey and they come up with the following figures:
“Human-induced climate change likely increased Hurricane Harvey’s total rainfall by at least 19%” (Risser and Wehner at al., 2017)
“We conclude that global warming made the precipitation about 15% (8%–19%) more intense” (van Oldenborgh et al., 2017)
Immediately these numbers should give one pause when they are compared to the 75% estimate from Frame et al. (2020). Does the paper claim that 75% of the damage from Harvey came from the additional 15% to 19% of precipitation? That would be theoretically possible if the additional 15%-19% of rain caused some physically meaningful threshold to be breached (like one corresponding to the height of a levee). However, the authors do not claim this and in fact, one of the authors calculates in a more recent study that the 20% increase in rain results in only a 15% increase in flood area (Wehner and Sampson, 2021).
Looking at the human influence on the magnitude rather than on the frequency of crossing an arbitrary threshold, yields an estimate of the damages from human influence of $13 billion (Wehner and Sampson, 2021). Taken at face value, this would indicate that the logical flaw in the “attributable costs” method led to an overestimation of the damages from Harvey by a factor of about 5.
However, I contend that even this type of calculation is misleading if one wishes to get a holistic sense of the economic impact of climate change in any given year. Frame et al. (2020) are indeed interested in this: in both the paper itself and in their CarbonBrief article they compare their damage estimate from Harvey to those from Integrated Assessment Models (IAMs) which correspond to mean damages for any given year. They argue that IAM-based damages must be huge underestimates because they only calculate annual mean costs of ~$20 billion per year in the US while their study attributes $67 billion to human influence for a single event (Harvey).
I argue that this too is a deeply flawed comparison because the rarity of an event like Hurricane Harvey would have to be taken into account to compare it to an annual mean estimate of damages from human influence on the climate. I illustrate what I believe is a better way to get a full sense of the human influence on economic damages below.
Expected Damages with and without Human Influence
Figure 1 illustrates a more complete way of estimating the economic damages from rainfall in Houston with and without climate change. This is intended to be an illustrative exercise and none of the exact numbers should be taken too seriously.
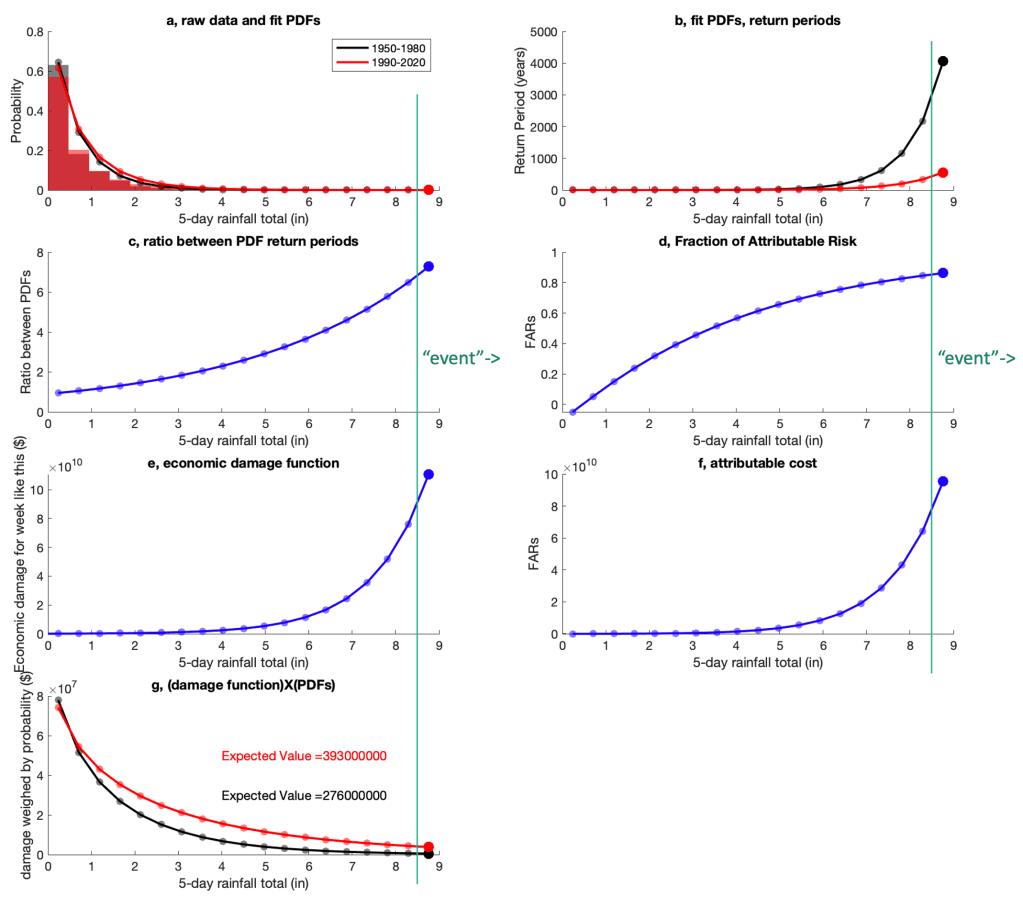
Figure 1a shows histograms of 5-day rainfall totals for the 30 year period from 1950 to 1980 (grey) and for the 30 year period from 1990 to 2020 (red) averaged over the broader Houston area. Superimposed are gamma distributions fit to the raw data. Gamma distributions are often used to model rainfall (Wilks, 2011) and although the fit is imperfect, these distributions exemplify the most relevant properties of how rainfall probabilities are thought to shift under warming. In particular, the distribution shifts in the most recent period such that the probability of low rainfall weeks is decreased and the probability of high rainfall weeks is increased (c.f., red and black in Figure 1a and 1b). Return periods and shifts in return periods of the most extreme events are also roughly in line with those calculated from more sophisticated methods.
In this example, the most extreme rainfall bin (above ~8.5 inches) shifts its probability from a once-in-4,300 year event in the 1950 to 1980 period to a once-in-600 year event in the 1990 to 2020 period (Figure 1b). Consistent with more comprehensive studies and basic theory, the more extreme the rainfall, the more the probability shifts between the two distributions. Figure 1c shows the ratio between the probabilities (or equivalently, return periods) between the two distributions, and Figure 1d shows the fraction of attributable risk to human influence on the climate (assuming that 100% of the shift in the rainfall distribution can be attributed to human influence).
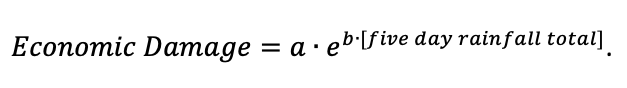
Now let’s suppose a “damage function” that estimates the economic damage as a function of rainfall totals. Small rainfall totals cause almost no damage but the largest rainfall totals can cause damage close to 100 billion (as seen in Harvey). A function that mimics this behavior (shown in Figure 1e) is the exponential function with a=1×10⁸ and b=0.8,
Multiplying the economic damage function by the ‘fraction of attributable risk’ gives us the “attributable cost” function (Figure 1f) which emphasizes how extreme the costs attributable to human influence get using this method: If we define an event to be an occurrence of the most extreme rainfall (thick circles in all plots), and that event occurs, then the costs attributable to human influence would be calculated to approach $100 billion.
However, as noted above, even in the most recent time period, this most extreme rainfall total is still a once-in-600 year event. Thus, if you want to estimate the annual average damage from this level of rainfall, you’d have to divide it by 600 to account for its rarity.
Thus, damages estimated from this single event (even if they are magnitude-based rather than frequency-based) could be off by two to three orders if they are interpreted as corresponding to an annual mean value.
More formally, the holistic way to compare the two climate states is to take the difference of the expected values of the damages between the current climate and the preindustrial climate. In doing this, the economic damage function is weighted by the corresponding probabilities and then summed across all values.
Figure 1g shows that as rainfall becomes more extreme, the rarity of the event reduces its impact on the expected value. We see a change in expected value from $276 million per year in the 30 year period from 1950 to 1980 to $393 million per year in the 30 year period from 1990 to 2100 or a total difference of $117 million per year attributable to climate change.
The IAM figure that Frame et al. (2020) claim must be a huge underestimate was $20 billion annual damage in the US from climate change. Comparing $117 million per year to $20 billion per year, is it possible that 0.6% of total us climate damages attributable to human activity comes from rainfall shifts in one of the largest metro areas on the gulf coast? I don’t know, but that calculation does not obviously invalidate the IAM estimate as Frame et al. (2020) claim to do.
I should note that the more the damage function is magnified at higher rainfall totals, the more the ‘attributable cost’ method will overestimate the costs from climate change relative to the more holistic ‘expected value’ method. Thus, a lot of effort should be placed on defining this damage function.
In conclusion, the ‘attributable cost’ method is not appropriate to apply when the ‘event’ must be defined with an arbitrary threshold on a variable that imposes costs on a continuum (rather than flipping costs on or off). It should only be applied if the ‘event’ is a real physical phenomenon that can be said to either ‘occur or not’ or if the threshold is physically meaningful (i.e., enough rain to overwhelm a levee). Applying the attributable costs method likely overestimated the economic damages from Harvey by a factor of about 5 (if the estimates of Wehner, M., Sampson, C. (2021) are taken at face value). Furthermore, if one wishes to compare the numbers produced from these types of analyses to existing annual mean damage estimates (e.g., from IAMs), the damages from extremes have to be weighed by their low probability of occurrence in any given year. In this case, not doing so could cause an overestimate of the annual mean costs of human influence on the climate by two to three orders of magnitude.
This is a very important topic and it’s crucial that the methods used to address it are as accurate as possible. I hope this post serves as constructive criticism and possibly helps inform future research in this area.
Appendix
Since writing this, I see that several of the authors of the Frame et al. (2020) study have published a paper (Perkins et al., 2022) walking back some of their claims and/or urging caution in interpreting the results of the ‘attributable cost’ method. It looks like the authors of this study would agree with several of the points I have raised here. However, I don’t see an explicit repudiation of the reported results of Frame et al. (2020) or any effort to correct any media coverage of the results.
References
Allen M (2003) Liability for climate change. Nature 421:891–892
Brown, P. T. (2016) Reporting on global warming: A study in headlines, Physics Today, doi:10.1063/PT.3.3310
Frame, D.J., Wehner, M.F., Noy, I. et al. (2020) The economic costs of Hurricane Harvey attributable to climate change. Climatic Change 160, 271–281. https://doi.org/10.1007/s10584-020-02692-8
Levin, M. (1953) The occurrence of lung cancer in man. Acta Unio Int. Contra Cancrum., 9, 531–541.
Perkins-Kirkpatrick, S. E. et al. (2022) Environ. Res. Lett. 17 024009. https://doi.org/10.1088/1748-9326/ac44c8
Risser, M. D., & Wehner, M. F. (2017). Attributable human-induced changes in the likelihood and magnitude of the observed extreme precipitation during Hurricane Harvey. Geophysical Research Letters, 44, 12,457–12,464. https://doi.org/10.1002/2017GL075888
Oldenborgh GJV, Wiel KVD, Sebastian A, Singh R, Arrighi J, Otto F, Haustein K, Li S, Vecchi G, Cullen H (2017) Attribution of extreme rainfall from Hurricane Harvey, august 2017. Environ Res Lett 12:124009
Wehner, M., Sampson, C. (2021) Attributable human-induced changes in the magnitude of flooding in the Houston, Texas region during Hurricane Harvey. Climatic Change 166, 20. https://doi.org/10.1007/s10584-021-03114-z
Wilks, D. (2011) Statistical Methods in the Atmospheric Sciences. 3rd addition, Elsevier.

Hello,
thank you for the post! I have a general question – is it still possible to publish this (or similar) article somewhere other than a personal blog? I’ve heard a lot about how science is “self-correcting.” But for this it is necessary for scientists to publicly debate on equal platforms. Is climate science still a “self-correcting” science, what do you think?
Pingback: Q&A: The evolving science of ‘extreme weather attribution’ – Renewable AI
Pingback: Q&A: The evolving science of ‘excessive climate attribution’ - nexonews
Pingback: Q&A: The evolving science of ‘extreme weather attribution’ - Natura Hoy
Pingback: Q&A: The evolving science of ‘extreme weather attribution’ | News | Eco-Business
Pingback: Q&A: The evolving science of ‘extreme weather attribution’ – BNS Global News
Pingback: Q&A: The evolving science of ‘extreme weather attribution’ | eMarbella.es
Pingback: Q&A: The evolving science of ‘extreme weather attribution’ – breakingclimatechange.com