
NASA released their 2016 global mean surface temperature data today. With this datapoint in, observations are now above the average climate model value for this point in time (using 1986-2005 as the baseline):
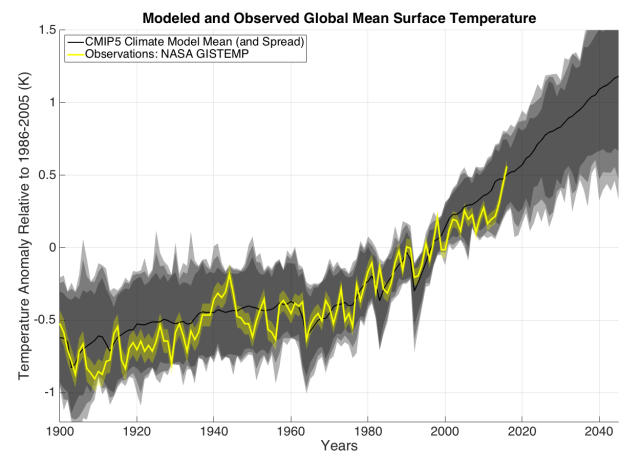
This graphic uses the RCP 4.5 emissions scenario for the models but the divergence between RCP 4.5 and steeper emissions scenarios is not appreciable until the mid-21st century (see e.g. Figure 1 here).

Patrick, do the model results for the 20th century use the actual forcings that were observed?
Hi David. Yes they use a ‘best estimate of historical forcing. This forcing estimate is shown in the figure here: http://www.pik-potsdam.de/~mmalte/rcps/
Pingback: Orfani della Beall's list - Ocasapiens - Blog - Repubblica.it
Pingback: Report Heartland Institute sent to influence US teachers on climate change earns an “F” from scientists - Climate Feedback