(The following was originally posted at Climate Lab Book)
As the attention received by the ‘global warming hiatus’ demonstrates, global mean surface temperature (T) variability on decadal timescales is of great interest to both the general public and to scientists. Here, I will discuss a recently published paper by my coauthors and I (Brown et al., 2014) that attempts to contribute to this scientific discussion by investigating the impact of unforced (internal) changes in the earth’s top-of-atmosphere (TOA) energy budget on decadal T variability.
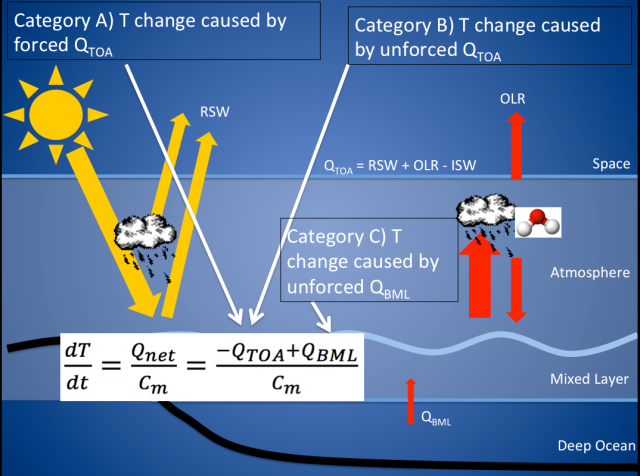
Figure 1 illustrates a very simple (but hopefully still useful) way to think about T change. In this model, T changes as a result of an energy imbalance (Qnet) on the system composed of the land, atmosphere and ocean’s mixed layer. Specifically, T change results from an energy imbalance at the TOA (QTOA, which is the difference between Reflected Shortwave Radiation (RSW) plus Outgoing Longwave Radiation (OLR) and Incoming Shortwave Radiation (ISW)) and/or at the bottom of the ocean’s mixed layer (QBML, positive up). Obviously there has been a great deal of research on T change associated with externally forced changes in QTOA (Category A in Figure 1; Myhre et al., 2013). Also, there has been quite a bit of research recently on decadal T change resulting from unforced variability in the exchange of heat between the ocean’s mixed layer and the ocean below the mixed layer (Category C in Figure 1; England et al., 2014; Balmaseda et al., 2013; Meehl et al., 2013; Trenberth and Fasullo, 2013). In our reading of the literature, however, less attention has been given to decadal T change associated with unforced changes in the TOA energy budget (Category B in Figure 1). This is the topic of Brown et al., 2014.
I should note here that Spencer and Braswell, 2008 stressed the importance of non-feedback TOA radiation variability on T change but that this is a slightly different focus than our study because we were not concerned with distinguishing between feedback-related and non-feedback related TOA imbalances. The study that is most closely related to our own is probably Palmer and McNeall, 2014 and many of our results are complimentary to theirs.
Figure 1. Simple energy balance model of the primary causes of global mean surface temperature change. In this model, T change results from a net energy imbalance (Qnet) on the land/atmosphere/ocean-mixed-layer system (where Cm is the effective heat capacity of that system). Brown et al., 2014 is concerned with T variability due to Category B. Note that Category B variability may itself be a feedback (rather than a 1st cause) of T change. Variations of this class of energy balance model have been used in many climate change studies (Baker and Roe, 2009; Dickinson, 1981; Geoffroy et al., 2012; Held et al., 2010; Wigley and Raper, 1990; Wigley and Schlesinger, 1985).
We investigated unforced control runs from the CMIP5 archive and looked at what the TOA energy budget was doing during decades when the models spontaneously simulated large changes in T (since these were unforced runs, there was no Category A variability, by definition). We found that unforced, decadal changes in T tend to be enhanced by TOA energy imbalances. In other words, during large-magnitude warming decades, the net flux at the TOA tended to be into the climate system and during large-magnitude cooling decades the net flux at the TOA tended to be out of the climate system. How much did the TOA energy imbalances affect temperature? We used published effective heat capacities of many CMIP5 models (Cm in Figure 1) to estimate that the TOA flux during these decades was responsible for approximately half of the change in T on average (the other half would be due to QBML).
It may seem counterintuitive that the net flux at the TOA would enhance (rather than reduce) T change because the Stefan–Boltzmann law might lead us to expect that as T decreases (increases), the amount of outgoing longwave radiation emitted to space should decrease (increase) exponentially.
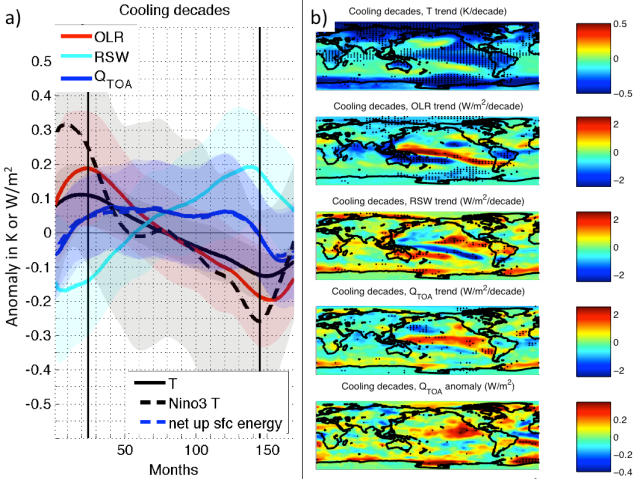
Figure 2 shows the temporal (Figure 2a) and spatial (Figure 2b) variability of temperature and energy flux variables over large-magnitude cooling decades. It can be seen that outgoing longwave radiation does in fact decrease during cooling decades but that the net TOA energy flux remains positive (out of the climate system) for most of the decade because reflected shortwave radiation tends to increase by roughly the same amount as outgoing longwave radiation decreases (Figure 2a). In other words, it appears that changes in the climate system’s albedo are able to temporarily counteract the changes in outgoing longwave radiation and thus sustain the net TOA imbalance for a longer period of time than might be expected otherwise. We find that these changes in albedo appear to be associated with changes in the state of the Interdecadal Pacific Oscillation (at least in the multi-model mean pattern). In particular, reflected shortwave radiation over the equatorial and eastern Pacific tends to increase as surface temperatures over that region decrease (Figure 2b).
Figure 2. a) Composite time series of temperature and energy flux variables over large-magnitude cooling decades (OLR: outgoing longwave radiation, RSW: reflected shortwave radiation, QTOA: upward oriented net TOA energy flux, T: global surface temperature, Nino3 T: surface air temperature over the Nino3 region, sfc net up: upward oriented net surface energy flux). The shading denotes the standard deviation of each value across all decades investigated (two largest-magnitude cooling decades from each of 36 CMIP5 control runs). b) Mean rates-of-change and anomalies of energy flux variables and surface temperatures over the same cooling decades shown in a. Stippling delineates the grid points where over 75% of the decades experienced the same signed value.
Something interesting about these model-based findings is that they appear to contradict observations over the past 10-15 years. In particular, it has been suggested that we are currently in an unforced cooling situation analogous to that illustrated in Figure 2 (e.g., England et al., 2014; Trenberth and Fasullo, 2013). These findings suggest that we should expect this unforced cooling to be enhanced by the net energy imbalance at the TOA (i.e., there should have been a decrease in the rate of climate system heat uptake over this period). However, our best inventories of total climate system heat content have indicated that just the opposite has occurred (as T has been in an unforced cooling state, the rate of climate system heat uptake as increased; Trenberth and Fasullo, 2013; Balmaseda et al., 2013). This is not what the CMIP5 models typically do, but it does happen (~13% of the cooling decades investigated were associated with net positive climate system heat uptake). In these rare decades, changes in QBML flux are large enough to overcome the gain in climate system energy and cause T cooling. This does seem consistent with the recent finding that an increase in Pacific trade wind strength has increased the rate of heat storage below the mixed layer (QBML) to unprecedented levels (England et al., 2014).
This study may raise more questions than it immediately answers and we hope to learn a great deal more as we dig into the results further.


