
A few people asked me about the accuracy of a recent NY Times Magazine / NY Times Daily Podcast story “How Climate Migration Will Reshape America”. It contains plenty of interesting discussion on e.g., property insurance under a changing climate but it is very loose with the facts on current climate change in the US and it continuously errs on the side of hyperbole and exaggeration.
Below I take a look at observational data corresponding to some of the claims in the article. Overall, I think the data gives a very different impression of the state of climate change in the US than does the rhetoric in the piece.
This is important because this kind of exaggeration undermines the credibility of the NY Times / NY Times Daily Podcast at a time when people really need journalism they can trust.
Furthermore, the issue of human migration under climate change is important and thus it needs to be covered in a serious and fact-based way. We cannot afford for this kind of sloppiness to give people an excuse to dismiss the entire premise.
Most of this piece’s claims are about the future. It is difficult to fact-check claims about the future so I will just look at a few claims that can be easily put in context against historical observational data.
Claim: “August besieged California with a heat unseen in generations.”
Context on CA heat: August 2020 was the fourth hottest month on record in California. It’s average temperature was 79°F. Not as hot as July 2018 (79.6°F), July 2006 (79.3°F), or July 1931 (79.5°F). So it was hot but not “unseen in generations”.

Claim: “I am far from the only American facing such questions. This summer has seen more fires, more heat, more storms — all of it making life increasingly untenable in larger areas of the nation”
Context on fires: The nation has not seen more fires through August but when September numbers are tallied this will indeed go up and likely will set a record. Though it is important to note that there is not an obvious nationwide long-term trend in wildfires.
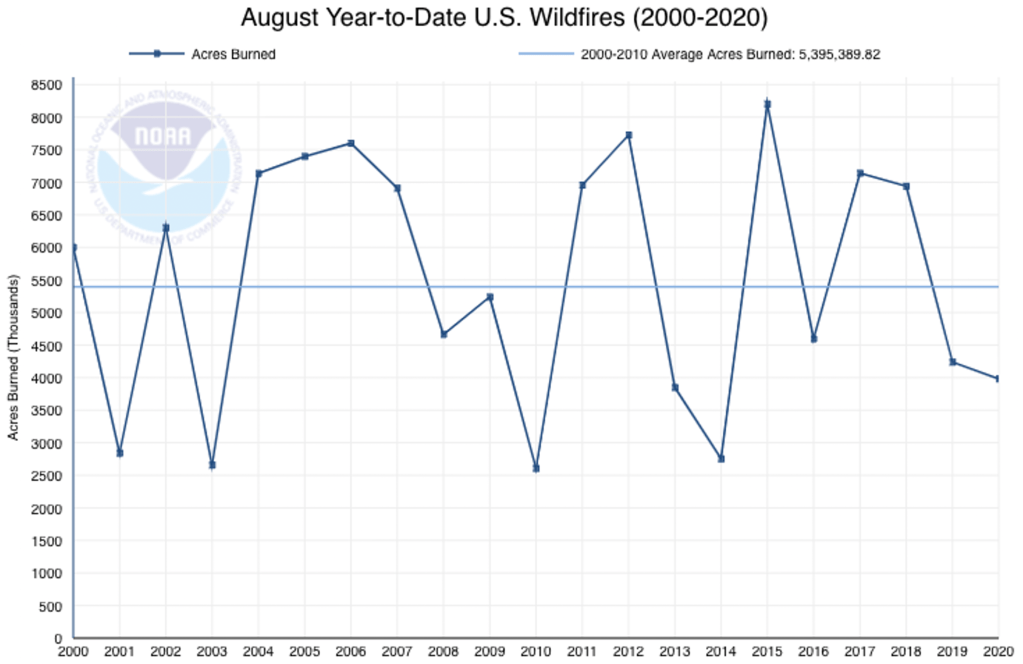
More context on fires: It is perhaps worth mentioning that global annual area-burned has decreased over the past 20 years. This illustrates that, thus far, climate is not a first-order influence on area-burned and its influence can be totally overwhelmed by other factors. https://www.weatherclimatehumansystems.org/faq-on-fires-humans-and-global-change
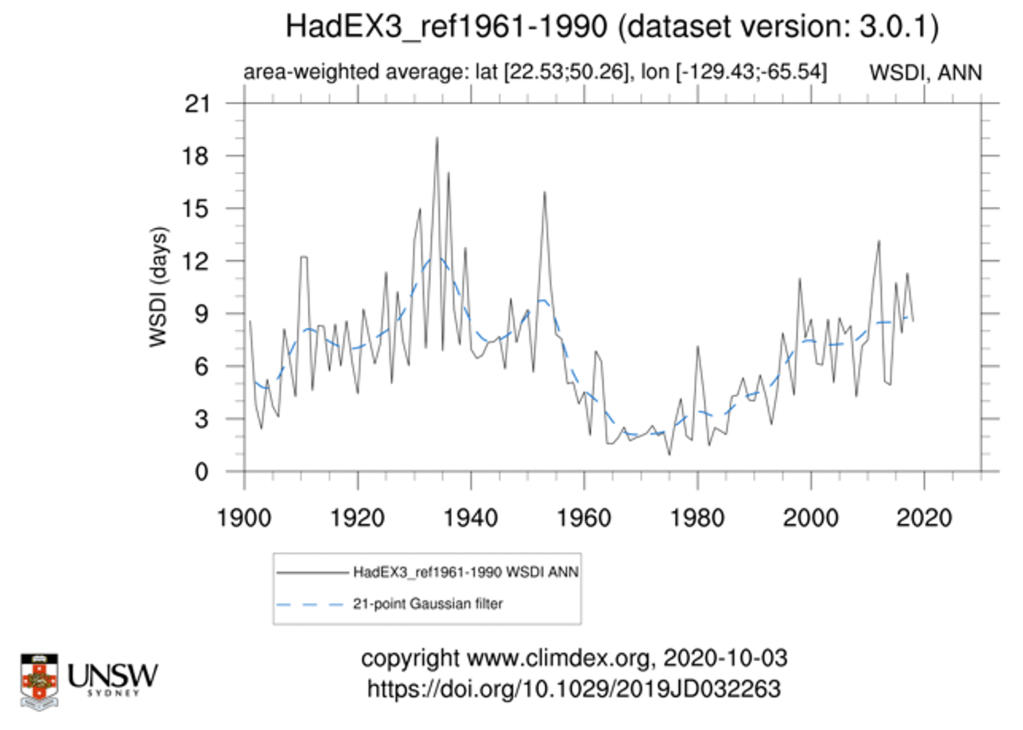
Context on US heat: It is true that this summer was hot in the US. It was the 4th warmest on record behind 2011, 2012 and 1936.

More context on heat: Rather than looking at summer means, we can look at indices that measure attributes of heatwaves like the “Warm Spell Duration Index”. Here’s what that looks like for the US. The 1920s and 1930s had higher values that what we have seen recently.
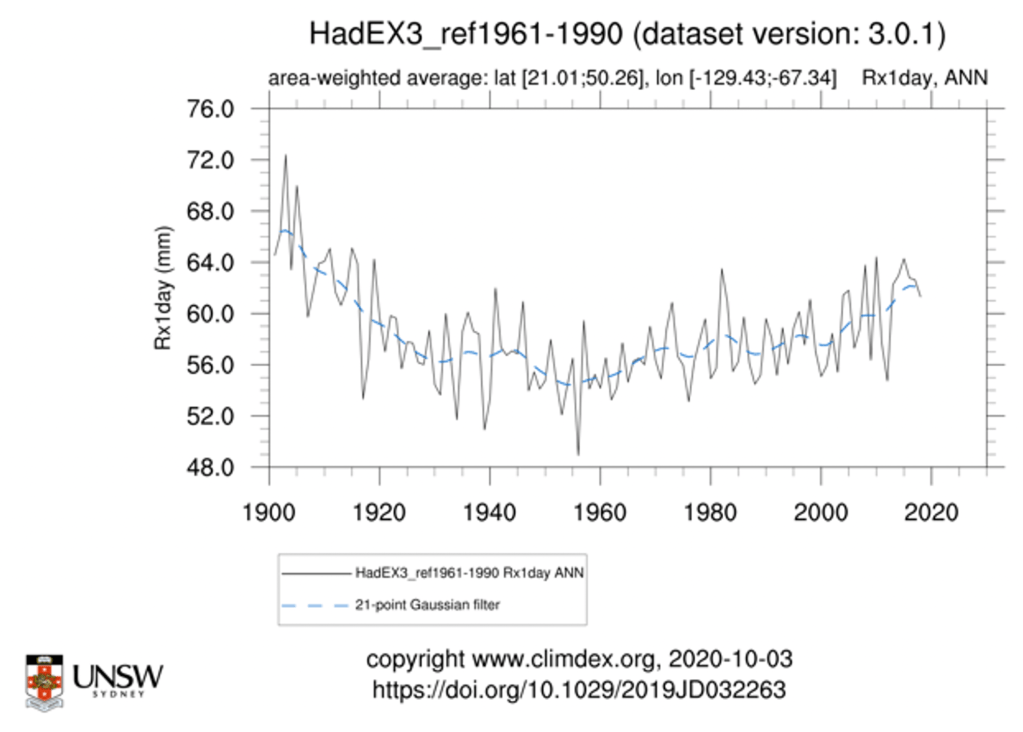
Context on storms: It is not clear what is meant by storms. But maximum 1-day precipitation might be a pretty good proxy for what most people think of as storms. There have been increases in this metric over recent decades but we are not at a historical maxima:
More context on storms: The author could also be referring to tropical storms. Below is a measure of tropical storms making landfall in the United States. We can see some increase in recent decades.

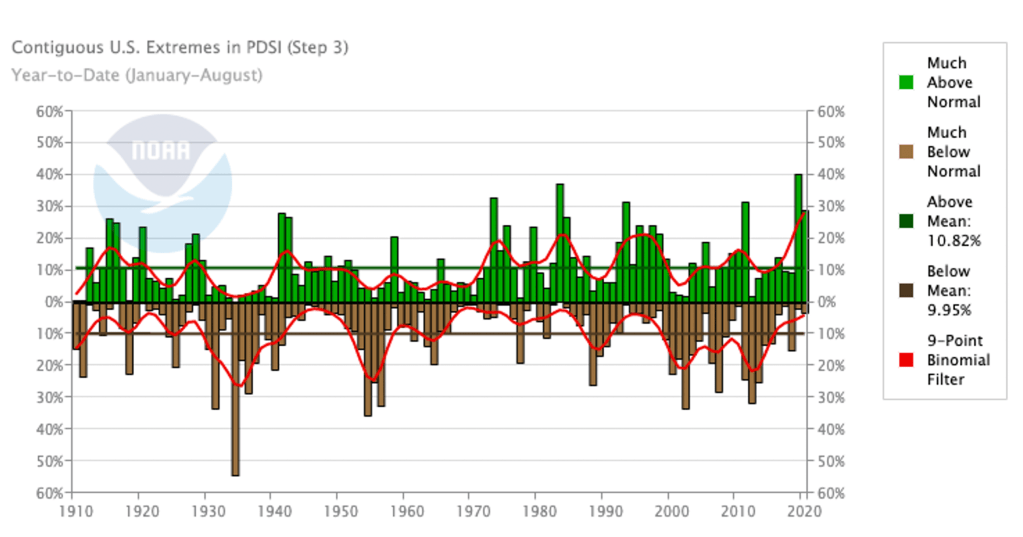
Claim: “Already, droughts regularly threaten food crops across the West…”
Context on droughts: The brown bars are the area in the US that are much more arid than normal. The US West has indeed seen bad droughts in the 2000s and 2010s. More on crops below.
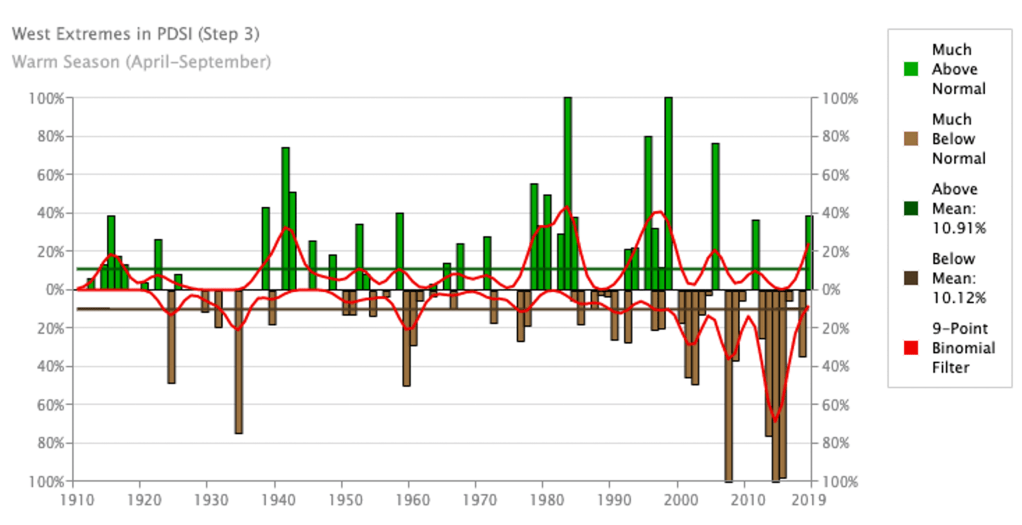
More context on droughts: It is worth noting that we do not see long-term trends in droughts over the US overall.
Claim: “while destructive floods inundate towns and fields from the Dakotas to Maryland”
Context on floods: Here is the long-term change in an index of maximum 5-day precipitation. While not a direct measure of floods, this can be thought of as a rough proxy. By this measure, we are not currently at a historical maxima.

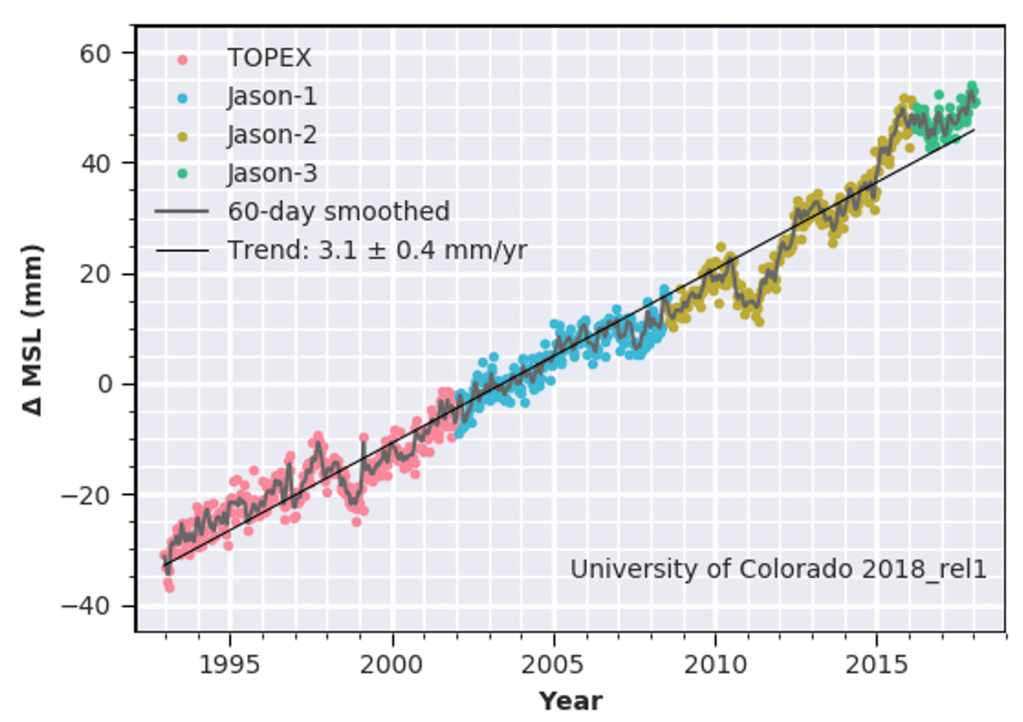
Claim: “Rising seas and increasingly violent hurricanes are making thousands of miles of American shoreline nearly uninhabitable.”
Context on rising seas: Global sea levels have risen about 3 inches since the mid 1990s. This will be a major problem as it continues but does 3 inches plus the change in tropical cyclones shown above amount to “thousands of miles of shoreline nearly uninhabitable”? Sorry, it does not.
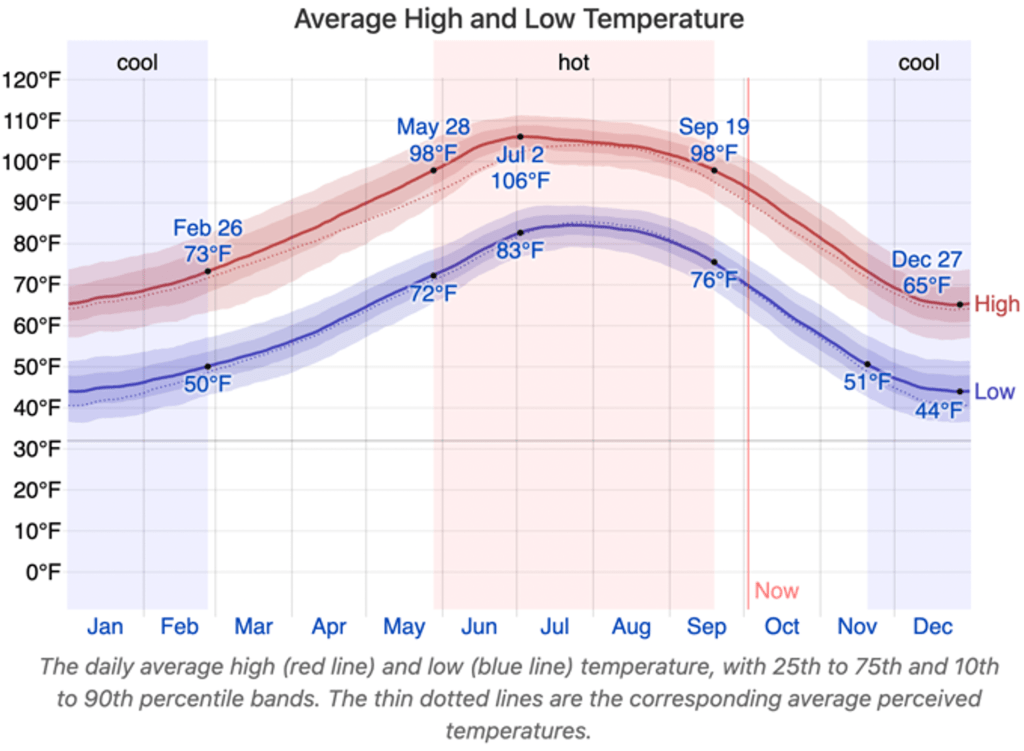
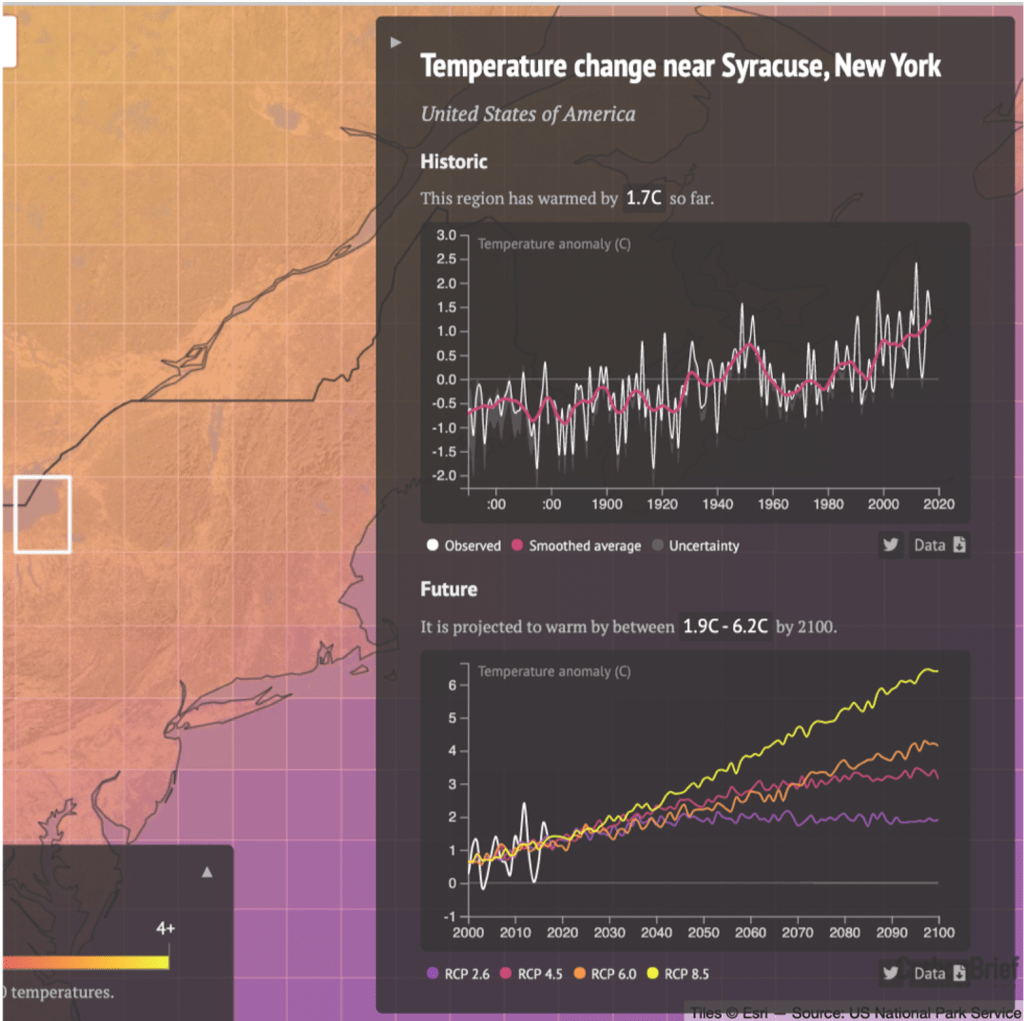
Claim: “Let’s start with some basics. Across the country, it’s going to get hot. Buffalo may feel in a few decades like Tempe, Ariz., does today”
Context: This is absolutely false. The average daily high temperature in July in Buffalo NY is near 79°F. The average daily high temperature in July in Tempe Arizona is near 106°F. That’s a 27°F difference.
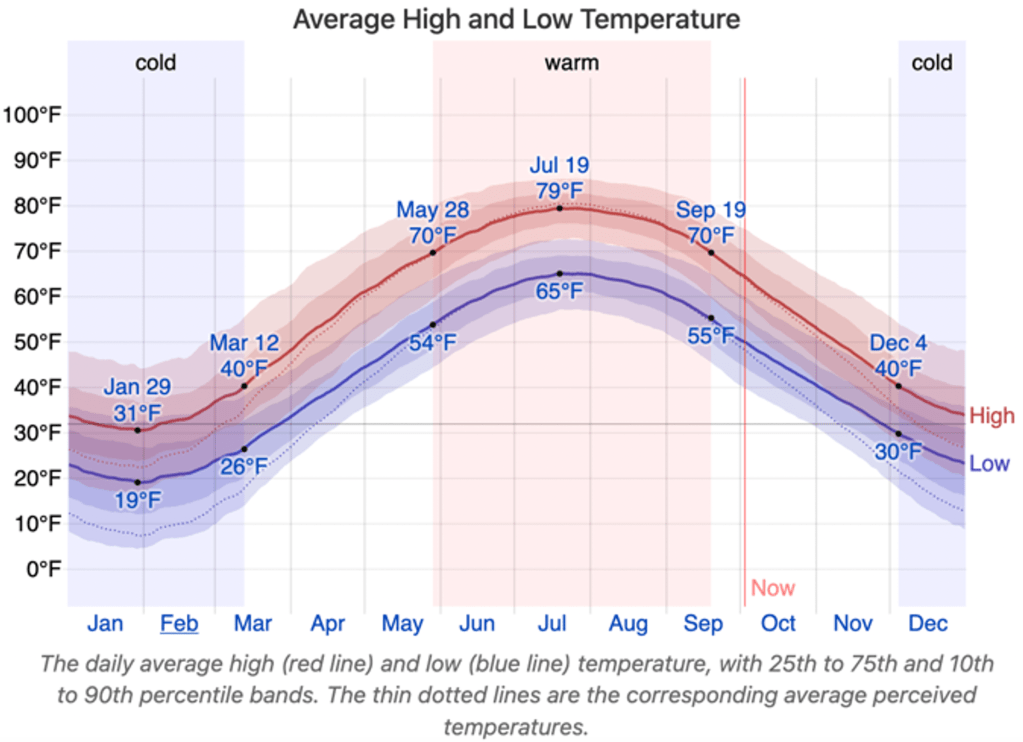
Buffalo is projected to warm by roughly 2.3°F under a medium emissions scenario by 2050 (and by 5°F by 2100). So that would mean that the author claimed a warming of something like 27°F “in a few decades” when our best estimate is something closer to 10% of that.
Claim: “The Great Plains states today provide nearly half of the nation’s wheat, sorghum and cattle and much of its corn; the farmers and ranchers there export that food to Africa, South America and Asia. Crop yields, though, will drop sharply with every degree of warming.”
Context on crop yields: Historically it has warmed and crop yields have only increased. For one thing, there has been little detrimental climate stress on US crops so far, as measured by indices like the Crop Moisture Stress Index:
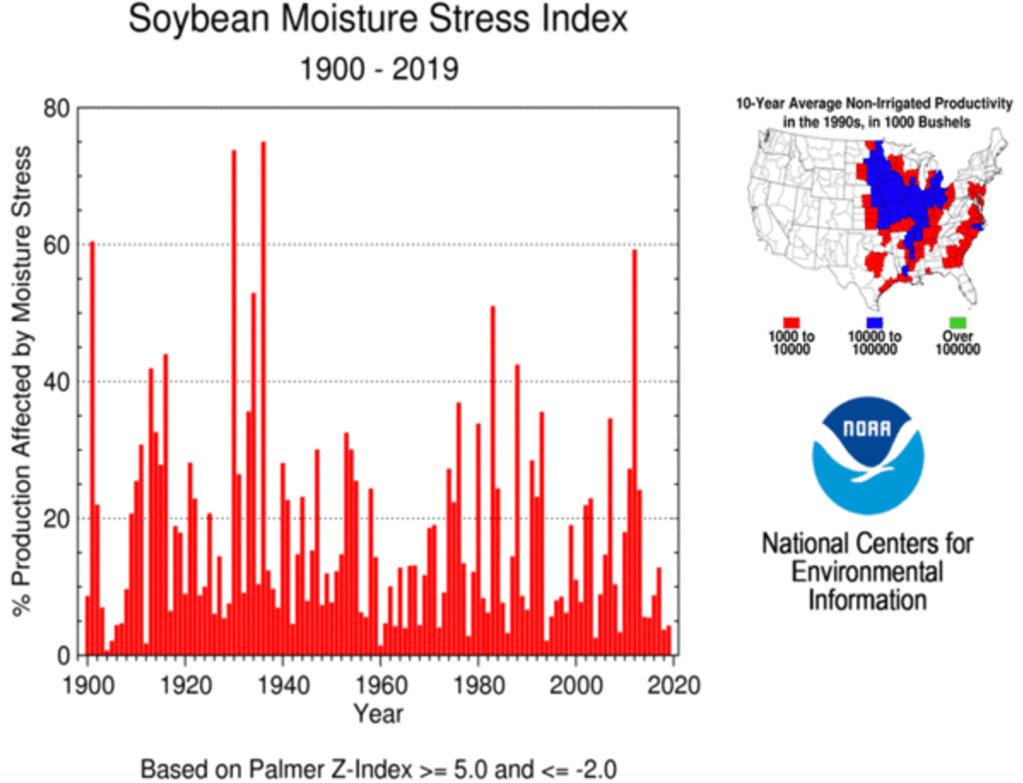
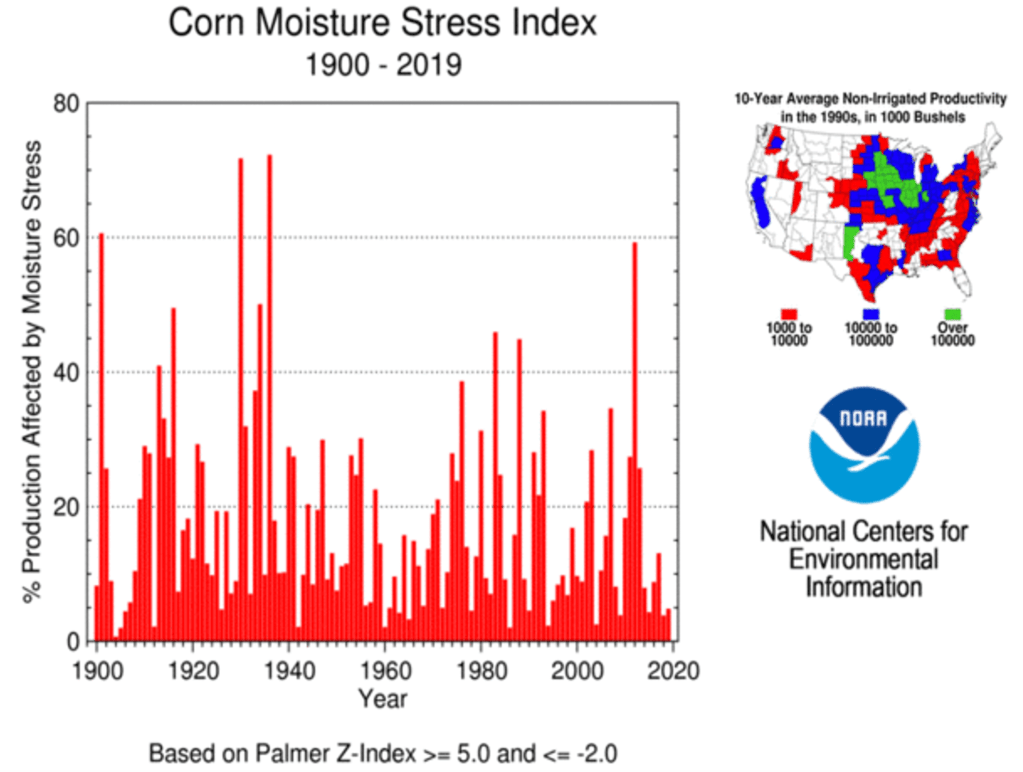
Further Context on crop yields: Yields of corn and other crops have only increased globally because changes in technology and agricultural practices have vastly outweighed any negative impact from climate. https://ourworldindata.org/crop-yields

Claim: “It was the kind of thing that might never have been possible if California’s autumn winds weren’t getting fiercer and drier every year”.
Context on CA autumn winds: The most infamous fire-enhancing autumn winds in CA are the “Santa Ana winds”. They are not increasing every year and projections suggest that their occurrence will be less frequent not more frequent under climate change.
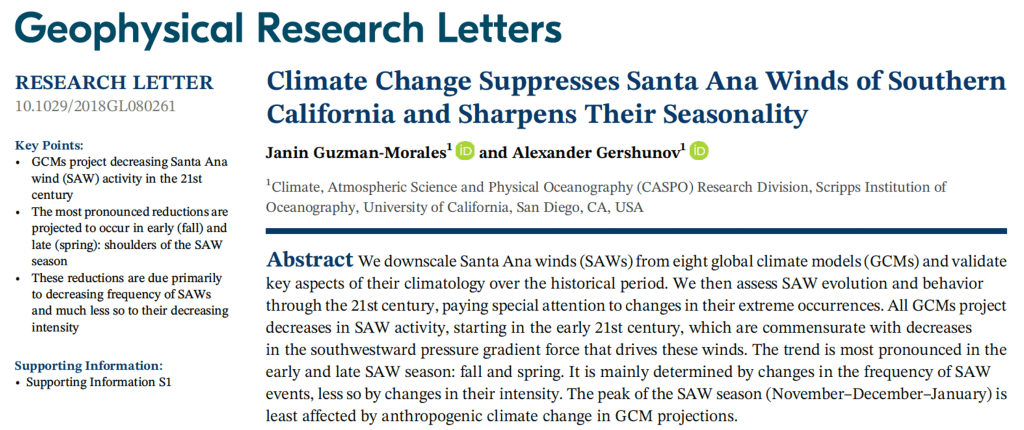
https://agupubs.onlinelibrary.wiley.com/doi/abs/10.1029/2018GL080261
Claim: “The 2018 National Climate Assessment also warns that the U.S. economy overall could contract by 10 percent.”
Context: This is a 10% contraction relative to a no-climate change scenario not 10% contraction relative to today. That distinction makes a huge difference. It means that the projection says that if GDP were to increase by 100% without climate change over the next 80 years (very conservative estimate) then climate change would cause GDP to “only” increase by 90%.
Claim: “Once you accept that climate change is fast making large parts of the United States nearly uninhabitable…”
Context: I am sorry but this is just not reconcilable with the data above.
I could go on with other claims made in this piece but I’ll stop here for now. You should get the idea. It paints a picture of current climate change in the US that is very different than the story that is told from looking at the actual observational data and all the errors are in the direction of overstating the negative impact on the US today.
The editors at NY Times Magazine / The Daily Podcast must think that being cavalier with the facts is OK because ‘sending the right message’ on climate change is more important than accuracy. I could not disagree more.
At a time when trust in institutions like the New York Times is faltering, and the right calls them fake news – they cannot afford to confirm that narrative. It makes it too easy for those who want to be dismissive of climate change to feel vindicated in that belief.
Plots above are mostly from: https://ncdc.noaa.gov/cag/ and https://climdex.org/access/

Pingback: Principle 12 Glittering Generalities do not Represent Pragmatic Environmentalism – Pragmatic Environmentalist of New York
Thank you for this post. I used it in one of mine: Glittering Generalities do not Represent Pragmatic Environmentalism (https://wp.me/p8hgeb-w1)